Today was another great session with shorts being cut early on. I warned many times that the stocks were weak in comparison to the S&P500, which set the pace for the rest of the session. ES, along with all other stocks listed in the Daily Plan, closed at the very bottom. This can be a result of several factors, such as an overall negative sentiment in the market or investors taking profits from long positions. The activity in today's session is likely to have an impact on tomorrow's trading. There is a chance that the S&P500 will open lower or traders may take advantage of today's low prices and enter into long positions. Additionally, there could be follow-through selling pressure as investors who failed to sell out of their positions today may continue to do so tomorrow. In conclusion, it is important to stay aware of the dynamics in the market and be prepared for potential opportunities or risks. Today's session can provide valuable insights on how price action might play out tomorrow.
Value Areas
3903 - 4042 / POC 3967
3825 - 3895 / POC 3864
4075 - 4172 / POC 4137
What is a bell curve and how can we interpret it?
Many have seen Bell Curves before which are how we interpret Volume Profiles. This breaks down Profiles into areas of value which are known as Value Area Low, Value Area High, and Point of Control. Using these values are one of the ways you can form a system to trade around. Using same concept of Bell Curve distribution, we apply these same values to Profiles which can vary depending on the timeframe being used. In Bell Curve terms these are known as the standard deviations.
Events
None
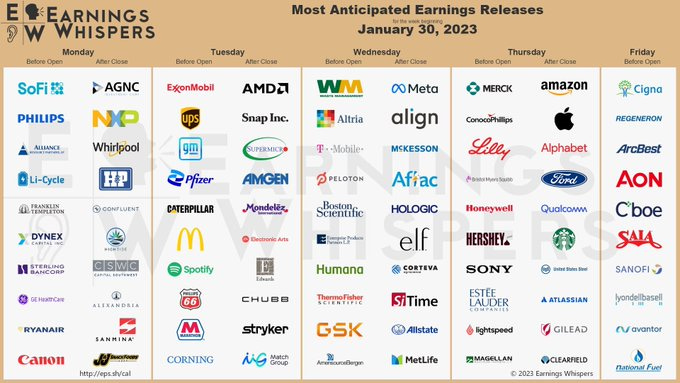
Earnings
Daily Plan 1/31/23
LEVELS
ES Long 4073 > 4102 / Short 4042 > 4009
NQ Long 12107 > 12260 / Short 12011 > 11860
SPY -0.37%↓ Calls 404.45 > 407.35 / Puts 401.71 > 397.39
QQQ -0.83%↓ Calls 293.63 > 297.22 / Puts 291.44 > 286.85
AAPL -1.17%↓ Calls 144.65 > 146.95 / Puts 143.64 > 141.14
TSLA -6.49%↓ Calls 170.95 > 179.07 / Puts 167.91 > 157.57
NVDA -4.09%↓ Calls 195.30 > 200.78 / Puts 192.66 > 186.49
MSFT -0.68%↓ Calls 244.38 > 246.9 / Puts 243.05 > 239.34
AMZN -0.88%↓ Calls 101.66 > 102.88 / Puts 100.98 > 98.78
AMD -2.99%↓ Calls 73.43 > 75.6 / Puts 72.8 > 70.88
AXP 0.08%↑ Calls 174.57 > 178.5 / Puts 173.34 > 169.62
-Flint
Disclaimer: This post is not trading or investment advice, but for general informational purposes only. This post represents my personal opinions which I am sharing publicly as my personal blog. Futures, stocks, bonds trading of any kind involves a lot of risk. No guarantee of any profit whatsoever is made. In fact, you may lose everything you have. So be very careful. I guarantee no profit whatsoever, You assume the entire cost and risk of any trading or investing activities you choose to undertake. You are solely responsible for making your own investment decisions. Owners/authors of this newsletter, its representatives, its principals, its moderators and its members, are NOT registered as securities broker-dealers or investment advisors either with the U.S. Securities and Exchange Commission, CFTC or with any other securities/regulatory authority. Consult with a registered investment advisor, broker-dealer, and/or financial advisor. Reading and using this newsletter or any of my publications, you are agreeing to these terms. Any screenshots used here are the courtesy of Ninja Trader, Think or Swim and/or TradingView. I am just an end user with no affiliations with them.


Share this post