


Mastering Volume Profile
Contents
Chapter 1: Introduction to Trading - What is it and Why It Matters
Chapter 2: Types of Financial Markets and Instruments
Chapter 3: Basic Trading Concepts – Price, Charts, and Timeframes
Chapter 4: Introduction to Technical Analysis
Chapter 5: The Role of Volume Trading
Chapter 6: What is Volume Profile?
Chapter 7: The History of Volume Profile – From Market Profile to Modern Tools
Chapter 8: Real-World Examples and Case Studies
Chapter 9: Key Concepts of Volume Profile – Breaking Down the Elements
Chapter 10: Types of Profiles
Chapter 11: Reading and Interpreting Volume Profile
Chapter 12: Trading Strategies
Chapter 13: Integrating Volume Profile with Other Tools
Chapter 14: Advantages, Limitations, and Common Pitfalls
Chapter 15: Tools and Software for Volume Profile Analysis
Chapter 16: Conclusion – Building your Volume Profile Edge and Next Steps
Disclaimer
General Risk Disclosure: Trading in the stock market involves substantial risk and is not suitable for every investor. The valuation of stocks may fluctuate, and as a result, clients may lose more than their original investment. The impact of seasonal and geopolitical events is already factored into market prices. The highly leveraged nature of stock trading means that small market movements will have a proportionally larger impact on your traded funds, and this can work against you as well as for you.
No Guarantee of Accuracy: The information provided in this newsletter is obtained from sources believed to be reliable and accurate; however, Flint Research does not guarantee its accuracy or completeness. The views, opinions, and analyses expressed herein are provided as general market commentary and do not constitute investment advice.
No Investment Recommendations or Professional Advice: Flint Research is not a registered investment advisor or broker-dealer. The content provided in this newsletter is for informational purposes only and should not be construed as investment advice. It does not constitute an offer or solicitation to buy or sell any securities or to adopt any investment strategy. Any decisions made based upon the information provided in this newsletter are the sole responsibility of the reader. We recommend that you seek advice from a qualified professional advisor before making any investment decisions.
Past Performance Not Indicative of Future Results: Past performance of a security or market is not necessarily indicative of future trends. Historical data should not be relied upon as a prediction of future market movements.
Regulatory Compliance: Flint Research complies with all applicable laws and regulations, including those set forth by the U.S. Securities and Exchange Commission (SEC). We are committed to maintaining the highest standards of integrity and professionalism in our relationship with you, our client.
Conflicts of Interest: Flint Research and its staff may hold positions in the securities mentioned in this newsletter. These positions can change at any time.
Use of the Newsletter: The information provided in this newsletter is intended solely for the personal, non-commercial use of its subscribers. Redistribution of this newsletter in any form is prohibited without the express written consent of Flint Research.
Chapter 1: Introduction to Trading – What is it and Why it Matters
Defining Trading: The Core Concept
At its essence, trading is the act of buying and selling financial assets—such as stocks, bonds, commodities, currencies, or derivatives like futures—with the primary goal of generating a profit. Unlike investing, which often involves holding assets long-term for growth or dividends, trading typically focuses on shorter-term price movements to capitalize on market fluctuations. Think of it as speculating on whether an asset’s price will rise or fall, without necessarily owning the underlying item.
For instance, if you believe the price of Apple stock (AAPL) will increase due to a new product launch, you might buy shares at $200 and sell them at $220 for a $20 profit per share. In futures like ES, which tracks the S&P 500 index, you could go long (buy) if you anticipate a market rally or short (sell) if you expect a downturn, profiting from the index’s movement without owning the actual stocks. This speculation is driven by supply and demand: when more buyers than sellers push prices up, or vice versa.
Trading has evolved dramatically with technology. In 2026, commission-free apps and AI-driven platforms make it accessible to anyone with a smartphone, democratizing what was once the domain of Wall Street elites. But remember, it’s not gambling—successful trading relies on analysis, strategy, and discipline.

A Brief History of Trading: From Barter to Blockchain
To appreciate trading’s importance, let’s trace its origins. Trading dates back thousands of years to ancient civilizations like Mesopotamia around 3000 BCE, where barter systems exchanged goods like grain for tools. By the Middle Ages, formalized markets emerged in Europe, such as the Antwerp Exchange in 1531, which dealt in commodities and bonds.
The modern stock market began in the 17th century with the Dutch East India Company issuing the first publicly traded shares in 1602, allowing investors to buy ownership stakes. The London Stock Exchange followed in 1801, and the New York Stock Exchange (NYSE) in 1792 under a buttonwood tree on Wall Street. These venues facilitated capital raising for businesses and wealth creation for individuals.
The 20th century brought electronic trading, starting with NASDAQ in 1971 as the first electronic exchange. The 1980s saw the rise of day trading with personal computers, while the 2000s introduced high-frequency trading (HFT) via algorithms. By 2026, blockchain and decentralized finance (DeFi) have integrated crypto trading seamlessly, with markets operating 24/7. This history underscores trading’s role in economic growth—companies like Tesla or Amazon raised billions through stock sales to innovate and expand.
Why Trading Matters: Economic and Personal Impacts
Trading isn’t abstract; it powers the global economy. At a macro level, it allocates capital efficiently: investors fund promising companies, driving innovation, job creation, and GDP growth. For example, the stock market’s performance often reflects economic health—the S&P 500’s rise in the 2020s post-pandemic signaled recovery.
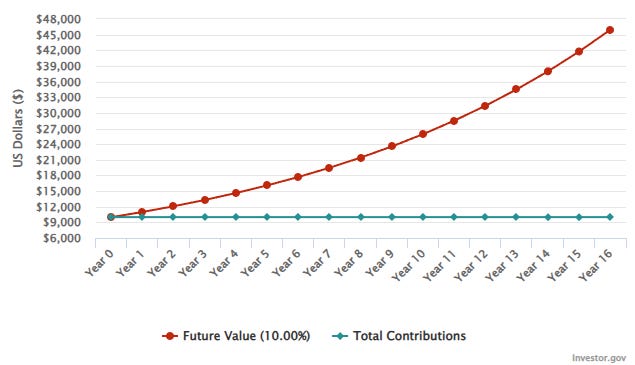
Personally, trading matters for wealth building. It offers potential returns far exceeding traditional savings accounts, especially with compounding. A $10,000 investment in the S&P 500 in 2010 would be worth over $48,000 by 2026, assuming average annual returns of about 10%. It also hedges against inflation—assets like gold or SPY shares can preserve value when currencies weaken.
Moreover, trading promotes financial literacy and independence. In an era of gig economies and uncertain pensions, learning to trade empowers individuals like you, to manage retirement or supplemental income through various strategies. However, it’s vital to approach it responsibly, as markets can be volatile.
Types of Trading: Styles and Timeframes
Trading comes in various flavors, classified by timeframe, strategy, and asset. Understanding these helps tailor your approach.
Day Trading: Buying and selling within the same day to avoid overnight risks. Ideal for volatile markets like ES, where you might scalp small moves based on news. Requires constant monitoring and quick decisions.
Swing Trading: Holding positions for days to weeks, capitalizing on short-term trends. For instance, spotting a breakout in a stock chart and exiting after a 5-10% gain.
Position Trading: Longer-term, months to years, based on fundamentals like earnings reports.
Scalping: Ultra-short trades, seconds to minutes, profiting from tiny price changes. Common in forex or futures.
Algorithmic Trading: Using software for automated trades, prevalent in 2026 with AI bots.
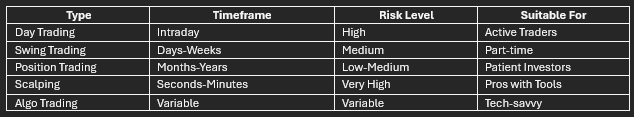
Each style demands different skills—day trading needs speed, while position trading requires patience.
Key Market Participants: Who’s Involved?
Markets aren’t faceless; they’re driven by diverse players.
Retail Traders: Individuals like us, using apps like Robinhood or Thinkorswim, etc. In 2026, they represent about 20% of daily volume, up from 10% in 2020.
Institutional Investors: Hedge funds, pension funds, banks—managing trillions. They move markets with large orders, which Volume Profile later helps detect.
Market Makers: Firms providing liquidity, quoting buy/sell prices.
Brokers: Intermediaries executing trades, e.g., Interactive Brokers.
Regulators: Bodies like the SEC ensuring fair play.
Understanding these helps anticipate moves—for example, institutional “whales” in ES can create order flow imbalances.
Risks and Rewards: The Double-Edged Sword
Trading’s allure is high rewards, but risks abound. Potential upsides include financial freedom, diversification, and excitement. A skilled day trader might aim for 1-2% daily returns, compounding to significant gains. However, risks include:
Market Risk: Prices can crash due to events or a large participant moving funds.
Leverage Risk: In futures like ES, leverage amplifies gains/losses.
Emotional Risk: Greed or fear leading to poor decisions.
Liquidity Risk: Hard to exit illiquid assets.
Statistics show 70-80% of retail traders lose money. Mitigate with stop-losses, diversification, and risk management—never risk more than 1-2% per trade is a common rule.
Trading is a dynamic blend of art and science, essential for personal finance and global progress. We’ve covered its definition, history, significance, types, players, risks, and entry points in detail to build confidence. As we progress to Volume Profile, remember: these basics are the soil from which advanced strategies grow. In the next chapter, we’ll explore types of financial markets and instruments, including futures like ES.
Chapter 2: Types of Financial Markets and Instruments
The Structure of Financial Markets: Centralized vs. Decentralized
Financial markets serve as platforms where buyers and sellers exchange assets, enabling price discovery, capital allocation, and risk management. They can be centralized (e.g., exchanges like NYSE or CME with strict rules and oversight) or decentralized (e.g., over-the-counter (OTC) markets where trades happen directly between parties). Centralized markets offer transparency, standardized contracts, and lower counterparty risk, while decentralized ones provide flexibility but higher potential for volatility.

In 2026, global markets are more integrated than ever, with technology blurring lines—think electronic platforms enabling OTC trades with exchange-like efficiency. For instance, the forex market, largely decentralized, sees daily volumes exceeding $9.6 trillion, dwarfing other markets. This structure impacts instrument trading: ES futures on the centralized CME benefit from high liquidity, ideal for Volume Profile analysis.
Major Types of Financial Markets
Markets vary by asset focus, each with unique dynamics and participants. Here’s a breakdown:
Stock Markets (Equity Markets): Platforms for trading company shares, representing ownership. Key exchanges: NYSE, NASDAQ, and global ones like LSE. In 2026, tech-driven stocks dominate, influenced by earnings and AI trends.
Bond Markets (Fixed-Income Markets): For debt securities like government Treasuries or corporate bonds. Global size exceeds $128 trillion (as of recent estimates, though growing). They provide income via interest; in 2026, with potential rate cuts, they’re attractive for stability.
Commodity Markets: Trading physical goods (oil, gold) via spots or futures on exchanges like CME. Hedging tools against inflation.
Forex (Foreign Exchange) Markets: Decentralized, 24/5 trading of currencies (e.g., EUR/USD). Daily volume ~$9.6T, driven by global events.
Derivatives Markets: For contracts derived from assets (futures, options). High leverage; ES is a prime example.
Cryptocurrency Markets: Decentralized, 24/7 for digital assets like BTC. Market cap ~$2.67T in 2026, volatile but maturing with ETFs.
These markets all interconnect.
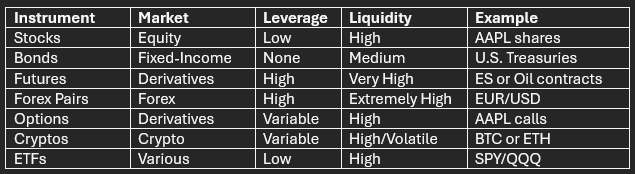
Key Financial Instruments: What You Actually Trade
Instruments are the building blocks traded in these markets. Categorized into cash, derivatives, and foreign exchange.
· Cash Instruments: Direct assets like stocks (equity ownership, e.g., AAPL) or bonds (debt, e.g., U.S. Treasuries yielding ~4% in 2026).
· Derivative Instruments: Value from underlyings, e.g., futures (ES contracts), options (rights to buy/sell BTC).
· Foreign Exchange Instruments: Currency pairs (EUR/USD, etc.).
Table for comparison:
Interconnections and Influences: How Markets Link
Markets influence each other: A bond yield rise (e.g., due to inflation) can pressure stocks, while crypto rallies might correlate with tech equities. In 2026, global events like policy shifts amplify links—e.g., Fed cuts boost forex and cryptos. Diversification across (e.g., stocks + bonds + BTC) mitigates risks.
We’ve dissected markets and instruments in detail, from forex’s trillions to crypto’s growth, setting the stage for how Volume Profile uncovers insights across them. Next, Chapter 3 dives into price, charts, and timeframes—the visuals of trading.
Chapter 3: Basic Trading Concepts – Price, Charts, and Timeframes
What is Price?
Price is the most fundamental concept in trading, representing the value at which an asset is exchanged between buyers and sellers at any given moment. It’s not a static number but a dynamic equilibrium shaped by supply and demand forces in the market. When demand outstrips supply, prices rise as buyers compete to acquire the asset; conversely, when supply exceeds demand, prices fall as sellers lower their offers to attract buyers. This interplay is influenced by a myriad of factors, including economic indicators like GDP reports, geopolitical events such as trade tensions, corporate earnings announcements, or even social media sentiment driving crypto volatility. For instance, in the stock market, a positive earnings surprise from a company like Tesla can surge its share price as investors rush in, while in forex, a central bank interest rate hike might strengthen a currency like the USD against the EUR, pushing the EUR/USD pair lower. In futures markets, external shocks like weather events can spike commodity prices, such as wheat futures rising due to droughts. Understanding price dynamics helps traders anticipate moves, but it’s the bid-ask spread that adds nuance: the bid is the highest price a buyer is willing to pay, and the ask is the lowest a seller will accept, with the spread reflecting liquidity and market efficiency. Narrow spreads in highly liquid assets like major forex pairs indicate easy entry and exit, while wider spreads in less liquid stocks signal potential slippage costs.
Beyond the basics, price can be dissected into components like open, high, low, and close (OHLC) over a period, which capture the range of trading activity. The open marks the starting price, the high the peak, the low the trough, and the close the ending value, offering a snapshot of sentiment—bullish if closes are higher than opens, bearish otherwise. This OHLC data is pivotal for tools like Volume Profile, which plots volume against these price levels to identify areas of high activity or “value.” In practice, traders monitor price action for patterns, such as breakouts where price surges beyond a previous high, signaling potential trends, or reversals where it fails to hold a low, indicating shifts. Consider a forex example: if the GBP/USD pair approaches a historical resistance level amid Brexit news, a failure to break through might prompt shorts, profiting from a decline. Similarly, in crypto, Bitcoin’s price often reacts to regulatory announcements, with rapid climbs or drops creating opportunities for quick trades. Mastering price requires recognizing that it’s not just a number but a reflection of collective market psychology, where fear and greed amplify movements, often leading to overreactions that savvy traders exploit through mean reversion strategies.

What’s the Purpose of a Chart?
Charts transform raw price data into visual stories, making complex market movements accessible and interpretable. They plot price over time, allowing traders to spot trends, patterns, and anomalies that might otherwise go unnoticed in numerical tables. The simplest form is the line chart, which connects closing prices with a continuous line, providing a clean overview of overall direction—upward for bull markets, downward for bears, or sideways for ranges. While useful for long-term views, like tracking the S&P 500’s multi-year uptrend, line charts lack detail on intraday volatility. Bar charts address this by representing each period (e.g., a day) as a vertical bar, with the top indicating the high, the bottom the low, a left tick for the open, and a right tick for the close. This format reveals the full price range and direction: a long bar with a close near the high suggests strong buying pressure. Candlestick charts, originating from 17th-century Japanese rice traders, enhance this further with colored “bodies” between open and close—green or white for bullish (close > open), red or black for bearish (close < open)—and “wicks” or shadows extending to highs and lows. These visuals convey emotion: a long upper wick might indicate rejection at highs, as sellers overpowered buyers.
Candlesticks form patterns like doji (open ≈ close, signaling indecision) or engulfing (one candle swallows the previous, hinting at reversals), which traders use to predict shifts. For example, in stocks like Amazon, a series of bullish engulfing candles after a dip could signal a buying opportunity, while in forex like USD/JPY, a shooting star (small body, long upper wick) at resistance might warn of a downturn.

Charts also incorporate volume bars at the bottom, showing trade quantity, which foreshadows our Volume Profile discussion by hinting at conviction behind price moves—high volume on up days confirms strength. In crypto, charts of Ethereum often reveal “cup and handle” formations, where price consolidates before breaking out, driven by blockchain upgrades. Overall, charts are indispensable for technical analysis, turning data into actionable insights, but their effectiveness depends on the chosen timeframe, which we’ll explore next.
The Differences in Timeframes
Timeframes dictate the lens through which traders view price and charts, influencing strategy and risk. Shorter timeframes, like 1-minute or 5-minute charts, capture granular movements ideal for day trading or scalping, where quick entries and exits exploit small fluctuations. In these views, noise is abundant—random wiggles from minor news or algorithms—but patterns emerge rapidly, such as in forex where EUR/USD might show repeated bounces off a 5-minute support during European sessions. Medium timeframes, like hourly or 4-hour charts, smooth out some noise, suiting swing traders who hold positions for days, focusing on intra-week trends influenced by data releases. For instance, a 4-hour candlestick chart of gold might reveal a clear uptrend amid inflation fears, allowing trades with wider stops to weather volatility. Longer timeframes, such as daily, weekly, or monthly charts, provide big-picture perspectives for position traders, emphasizing major trends over months or years. A weekly chart of the Nasdaq index could highlight multi-year bull runs driven by tech growth, ignoring daily dips.
Choosing a timeframe aligns with trading style and asset: scalpers favor tick or 1-minute charts in liquid markets like forex or ES futures for precision, while investors use monthly charts for stocks to assess fundamentals. Multi-timeframe analysis adds depth—confirming a daily uptrend with alignment on weekly charts reduces false signals. In crypto, a 15-minute chart might suit volatile BTC trades, but switching to daily reveals broader cycles tied to halving events. Timeframes also affect Volume Profile application: shorter ones show intraday value areas, longer composites reveal multi-session distributions. Ultimately, mastering timeframes involves balancing detail with overview.
To compare, shorter intervals demand constant attention and tight risk management due to frequent signals, often with smaller profit targets but higher trade frequency, whereas longer ones allow for larger moves with fewer trades, suiting those with less screen time but requiring patience through drawdowns. For example, a day trader might use 5-minute charts on AAPL to capture post-earnings volatility, aiming for 1-2% gains per trade, while a swing trader on the same stock employs daily charts for 5-10% swings over weeks. This flexibility makes timeframes a powerful filter, adapting analysis to personal goals and market conditions.
In this chapter, we’ve unpacked the intricacies of price as the core driver of markets, charts as the storytelling medium, and timeframes as the adjustable perspective, all interwoven with examples from stocks, forex, crypto, and beyond. These elements equip you to interpret market data effectively, paving the way for technical analysis in Chapter 4 and eventually Volume Profile’s volume-centric insights. With a solid grasp here, you’ll approach trading with greater clarity and confidence.
Chapter 4: Introduction to Technical Analysis
As the guide advances from the core concepts of price, charts, and timeframes in Chapter 3, the focus now shifts to technical analysis—the methodical examination of historical market data to predict future price directions. This approach posits that patterns in price and volume recur due to consistent human responses to market conditions, serving as a vital toolkit for traders in diverse arenas, from evaluating equity trajectories in firms like Alphabet to detecting shifts in currency pairs such as NZD/USD. Unlike fundamental analysis, which delves into economic metrics like revenue growth or inflation rates, technical analysis concentrates on observable chart behaviors. This chapter lays out the principles, essential indicators, prominent patterns, and real-world implementations, preparing the ground for volume’s role in the next chapter and ultimately Volume Profile’s detailed volume mappings.
Core Principles of Technical Analysis
Technical analysis is based on three main ideas: First, markets already include all known information in their prices. Second, trends keep going until something clearly stops them. Third, market patterns repeat because of how people think and act. These ideas come from Charles Dow’s theory in the late 1800s, which focuses on studying charts directly instead of outside factors. For example, during a rise in commodity prices like copper in a booming economy, analysts look at how prices follow upward channels on charts, rather than digging into supply chain issues, to see ongoing demand. This approach makes trading fairer, letting everyday traders analyze data using simple tools. Today these basics still hold, emphasizing what charts show about buyers and sellers. In cryptocurrencies, for instance, Ethereum often forms wedge patterns during tech updates, showing how trader emotions create repeating setups that lead to big price moves when news triggers them.
Key Indicators in Technical Analysis
Indicators apply calculations to price data. They reveal trends, momentum, volatility, and turning points. Moving averages are straightforward and widely used. They smooth prices over a chosen period. A 50-period average often serves as support in uptrends or resistance in downtrends. In tech stocks, a shorter average crossing above a longer one can signal a buy opportunity. Weighted averages give more importance to recent prices. This makes them responsive in fast markets like currencies. Momentum oscillators track speed. The RSI is a common one. It moves between 0 and 100. Levels above 70 suggest overbought conditions while below 30 indicate oversold. Divergences appear when price reaches new highs but the oscillator does not. These often signal upcoming changes. Volatility bands surround a moving average using standard deviations. Bands tighten during calm periods and expand during active ones. This helps spot potential breakouts.
Chart Patterns and Their Interpretations
Patterns develop from repeated price formations. They indicate whether trends will continue or reverse. Trader psychology drives these shapes. Continuation patterns form as brief pauses after strong moves. Flags are a typical example. They show short consolidation before the trend picks up again. This occurs often in rising markets. Reversal patterns mark trend endings. Head and shoulders is well-known. It features a central high peak with lower peaks on each side. A drop below the neckline confirms a top. Double bottoms create two similar lows and point to upside shifts. Harmonic patterns rely on ratios to forecast turns. Confluence strengthens signals. For instance, a rounded bottom in a crypto coin can break higher on positive news. Patterns gain reliability with confirmation. False breaks happen frequently. Check multiple timeframes for better results.
Support, Resistance, and Trend Tools
Support and resistance form at past highs and lows. Support prevents further drops. Resistance limits rises. Levels often switch roles after breaks. Broken resistance may turn into new support. Trendlines link highs or lows. They display direction and pace. Channels use parallel lines to contain price action. Traders buy at the lower line and sell at the upper in ranges. Fibonacci tools apply specific ratios like 38.2% or 61.8%. They help find likely pullback zones from major swings. Strong setups emerge when elements align. A moving average meeting support near a Fibonacci level creates higher-probability trades.
Practical Applications and Strategies
Applying technical analysis means blending tools into clear plans. Test strategies on historical data first. Day traders in currencies might enter on momentum extremes with reversal candles at support. Swing traders in stocks often use crossover signals within the main trend. In crypto markets, cloud indicators provide overall direction. Price above the cloud supports long positions. Risk management stays essential. Tools like average true range set stop distances. Keep risk small per trade. Current scanners quickly highlight opportunities. Human judgment refines them. Avoid fitting strategies too closely to past results. Technical analysis turns charts into practical guides as it measures market emotion through data.
There’s an endless number of strategies to make with all the available technical tools. Just like all these provide value, we will soon focus on why I chose Volume Profile over these. This is not to say I don’t use other indicators, but for intraday ES trading, I only use Volume Profile.
Chapter 5: The Role of Volume in Trading
With the framework of technical analysis now established in Chapter 4, the guide turns to volume as an essential companion to price. Volume measures the total number of shares, contracts, or units traded during a specific period and provides critical insight into the strength or weakness behind price movements. While price shows direction, volume reveals conviction. This chapter explores how volume confirms trends, signals potential reversals, and enhances trading decisions across various markets including stocks, currencies, commodities, and cryptocurrencies. Understanding volume prepares readers for the more advanced concepts in Volume Profile, which takes volume analysis to a new level by mapping it directly to price levels.
Understanding Volume: The Basics and Its Mechanics
Volume represents the activity level in a market at any given time. It appears most often as bars below a price chart where taller bars indicate higher trading activity. High volume during a price advance suggests strong participation and increases the likelihood that the move will continue because many traders are committed to the direction. Low volume on the same advance raises doubts about sustainability since fewer participants drive the change. This difference stems from the fact that large institutions typically move markets with substantial orders and their involvement leaves clear volume footprints. For example, when a major stock rallies on earnings news with volume far above average, the move gains credibility as a meaningful shift rather than random noise. In decentralized markets like forex, volume is often approximated through tick data yet still offers valuable clues during major economic releases. Derivatives markets add another layer with open interest showing ongoing commitments beyond daily turnover. Overall, volume serves as a reality check for price action and helps separate meaningful developments from temporary fluctuations.
Volume’s Role in Confirming Trends and Momentum
Volume plays a central role in validating trends because rising volume in the direction of the trend signals growing participation and reinforces momentum. An uptrend accompanied by steadily increasing volume demonstrates that buyers remain aggressive and willing to pay higher prices, which supports further gains. Declining volume within the same uptrend often warns of weakening interest and possible exhaustion as fewer new buyers enter the market. The same principle applies in reverse for downtrends where heavy volume on declines confirms seller control while lighter volume hints at potential relief rallies. Traders frequently combine volume with momentum indicators discussed earlier to spot divergences that foreshadow changes. For instance, when price reaches new highs on diminishing volume, the rally loses conviction and becomes vulnerable to pullbacks. This pattern appears regularly in commodity cycles where initial supply shocks drive prices higher on massive volume but subsequent gains on lower volume often mark the peak. Cryptocurrency markets provide dramatic examples where explosive rallies backed by record volume tend to extend farther than those driven primarily by speculation on thin participation.
Using Volume to Identify Reversals and Breakouts
Volume often provides early warning of reversals and reliable confirmation of breakouts. At potential bottoms, an extreme spike in volume known as a selling climax reflects panic liquidation after which buying interest can emerge and stabilize prices. The subsequent recovery on moderate but steady volume indicates accumulation rather than short covering. At tops, distribution shows itself through high volume without meaningful upside progress as informed sellers unload positions. Breakouts gain trustworthiness when price moves beyond a range on above-average volume because the surge suggests committed participants willing to push through previous barriers. Low-volume breakouts frequently fail and trap traders on the wrong side. Options markets offer additional clues through unusual volume in specific strikes that can precede directional moves in the underlying asset. In practice, tools like on-balance volume accumulate volume based on daily direction and help reveal hidden strength or weakness even when price appears stable. These volume-based signals become especially valuable in volatile environments where price alone can deceive.
This chapter has examined volume from its fundamental mechanics to practical applications across markets and strategies. The next chapter introduces Volume Profile itself, which builds directly on these concepts by distributing volume across price levels for even deeper insight.
Chapter 6: What is Volume Profile?
The previous chapter on volume set the stage for a more sophisticated way to use this data. Volume Profile takes the concept further by showing not just how much volume occurred over time but where it occurred across price levels. This tool displays trading activity as a horizontal histogram attached to the price axis of a chart. It reveals the prices where the market spent the most time and traded the heaviest volume. Traders across stocks, futures, forex, and cryptocurrencies use Volume Profile to identify areas of value, support, resistance, and potential turning points. This chapter explains the fundamentals of Volume Profile, how it works, and why it offers a clearer view of market structure than traditional volume indicators alone.
