

What is Volume Profile?

Most know volume as a tool tracking Volume by Time, but Volume Profile shows Volume by Price. Rather looking at when buyers/ sellers stepped into the market we can now see at what price these buyers/ sellers stepped in. Allowing to see at what prices institutions are participating marking what is and is not fair price, value. This is used to form context around prices giving possible indication where the market wants to move. None of this can be seen with volume by time or any indicator that many traders will throw at you, all of that is nonsense. Volume Profile alone can guide you through markets if you use it properly. Everyone will find what works best for them but in the end Volume Profile is superior to everything. If you want to dig even deeper into Orderflow stay tuned for my DOM (Depth of Market) series that will be coming in the future. DOM shows each order going through but also what type of order, adding context to the trades. Early 2023 I will roll out a substack on risk management so you can then apply volume profile setups with a profitable trade system. This will tell show you exactly how I map out all of my stop losses. Let's dive into Volume Profile...
What is a bell curve and how can we interpret it?
Many have seen Bell Curves before which are how we interpret Volume Profiles. This breaks down Profiles into areas of value which are known as Value Area Low, Value Area High, and Point of Control. Using these values are one of the ways you can form a system to trade around. Using same concept of Bell Curve distribution, we apply these same values to Profiles which can vary depending on the timeframe being used. In Bell Curve terms these are known as the standard deviations.

A standard bell curve is broken into 3 standard deviations which is symmetrical on each side. When looking at profiles this will be very hard to see on your own, but platforms have tools that can map these areas out automatically. Noting standard symmetrical Bell Curve, the areas go as so, 34.1%, 13.6%, 2.1%. Knowing these areas, we can know that between 34.1% area this sits in 68% of the value area, 13.5% and beyond is 99% of value area. Each area has its own meaning and can tell signs of what may happen next offering plenty of opportunities.
This will not be familiar at all but with time and practice you will become natural with all of this. Will takes months to years of screen time but overtime you will realize how prices react to these value areas. Taking notes each day will help significantly as you will notice how stocks behave relative to how value is distributed. Set solid understanding of Bell Curves before moving on to learning about Profiles, else this will confuse you.
Standard Deviations, VAL, VAH, POC, Mean Reversion
Don't expect to be able to look at profiles and instantly see bell curve distributions. Note when in bull market making ATH, we are creating new pockets of value which you will then have to watch new areas of value form. Without seeing a complete or nearly filled in curve you will be confused what will come next. Once through this you should have a relative understanding how to approach all market conditions.
Reason this was brought up was key terms you must know will be VAL, VAH, POC, HVN , LVN. Depending on how much of the bell curve is filled in will determine where these values line up. Profiles nearly filled in will have the most potent levels. The point of the Profile (bell curve) with the most volume is known as the POC. Prices will treat this level as a magnet which will be used more times than not as a target. VAH and VAL are symmetrical as in they both are 34.1% of the volume from POC. This is the first standard deviation from the POC (point of bell curve). Putting a bell curve sideways you place the VAL at the 1st lower standard deviation and VAH at the 1st upper standard deviation. We now can say that 68% of the volume was traded between VAL & VAH. Market over 70% of the time is balancing between prices which VAL & VAH are great references to these areas of rejection. Values outside of the 68% of value I don’t pay attention to unless we begin to shift value outside of the bell curve. For quick thoughts on these terms, possibly Short VAH and Long VAL with both targets set to POC or the other side of value. So Long VAL to POC / VAH or Short VAH to POC/ VAL. Another idea is when price ventures to new value you can take same approach but keep target being POC.
POC = Highest point of Profile (Most Volume)
VAH = 1st Standard Deviation above POC (upper 68% of Volume)
VAL = 1st Standard Deviation below POC (lower 68% of Volume)
IB = Initial Balance (1st hour of Cash Session RTH)
How bell curves look as profiles
Unfortunately, this is not an exact science, and the Profiles will not look exactly like the Bell Curve and sometimes look nothing like one when seeking new value (trend day). Knowing this means there are different types of profile structures that can pan out. The goal is to spot the day type early in session to set tone for the rest of the day whether that’s short bias or whatever market conditions are prevalent that day. Each day is completely different so let's begin with laying out the basics of what balanced and imbalanced markets mean.
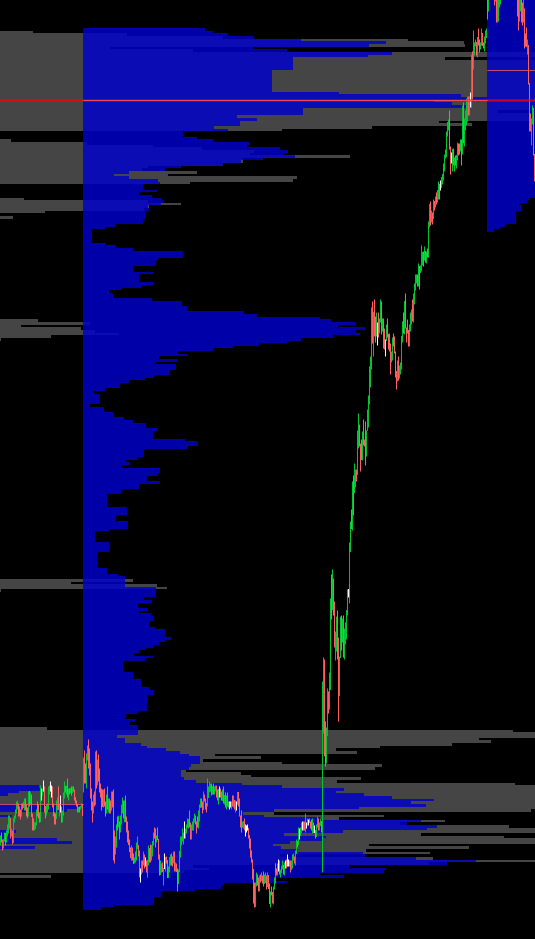
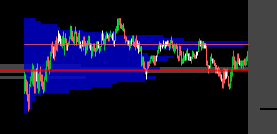
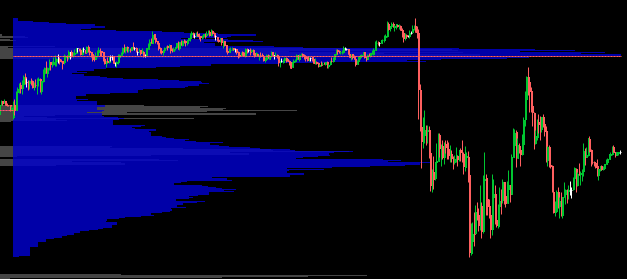
Balanced Market: These are range bound days and are the most common out of all of them. My personal favorite to trade as there’s nearly a setup Daily. Balanced markets show there is a lack of conviction among the other timeframe buyers and sellers and typically results in a two-way auction process and the price movements occur within the range.
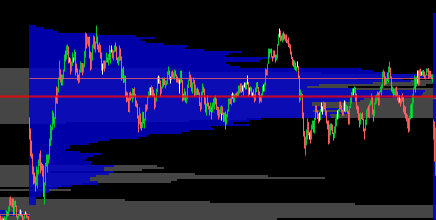
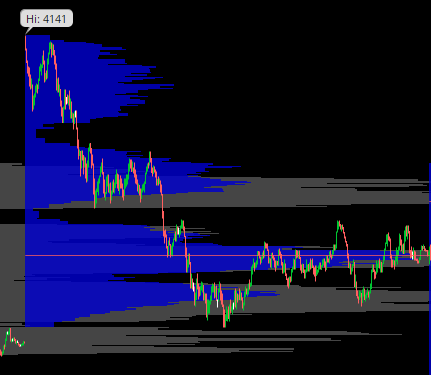
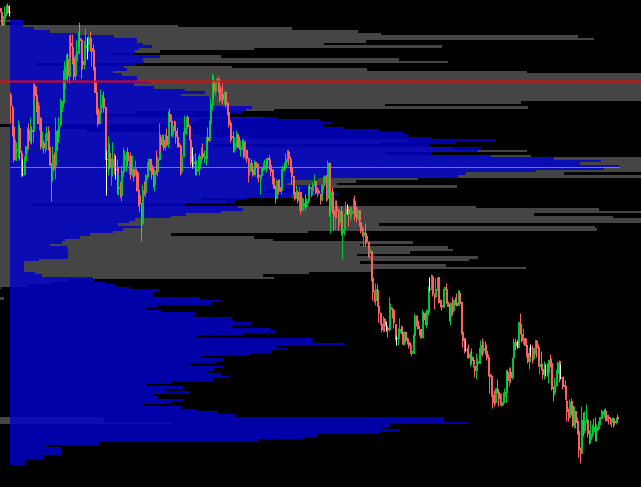
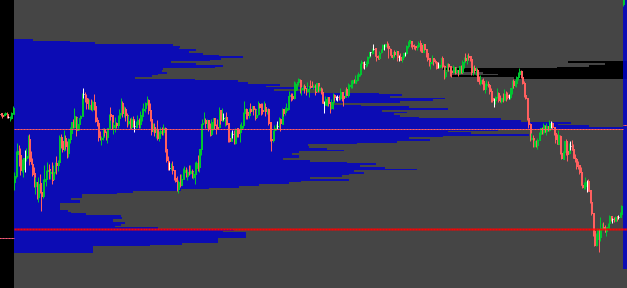
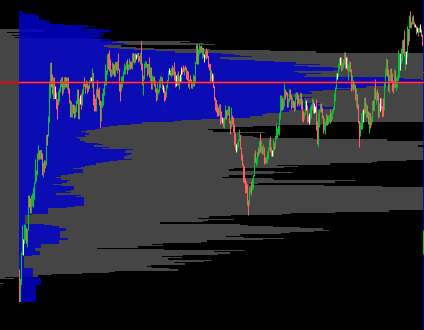
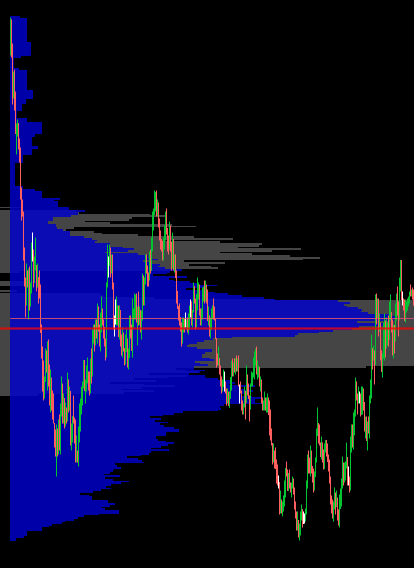
**All Examples below will be based on the BLUE Profiles (Daily)**
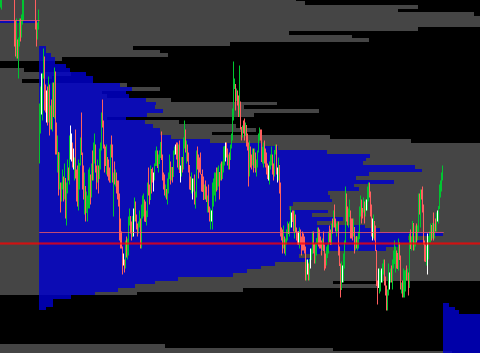
Imbalanced Market: Trending Market (uptrend or downtrend). This shows the conviction of other timeframe participants. Price will move in once direction with bumps of volume throughout the profile. The example below was an FOMC meeting which drove prices higher late in the day. Creating bumps in the Profile on the way up with no balance taking place.
Non-Trend Day is a balanced volume profile which occurs before an event, news, another one is post earnings which can result in lack of participation in market. Range (high-low) for the day is very compressed and the risk-rewarding nature for an intraday trader is very less. Such days are characterized by low volume where long timeframe players dominance is clearly missing and the day is purely controlled by Day timeframe traders. Only scalping the market favors an intraday trader on these non-trend days.
Normal day is a balanced volume profile but with a wider Initial Balance. It occurs 65% of the total profile. The structure will be wider than all other days. Trading centers around the point of control (fair place to conduct any business). One-sided range extension is seen or at time price trades around the wider initial balance with more trading activity balancing around the point of control.
Normal Variation Day is usually an imbalanced profile, with majority of participants being long term (Buyers or Sellers). Long term participants are waiting for the market to settle down where they consider the price to be fair and then they drive market aggressively post 1100 EST or 1200 EST with the range extension outside the initial range. The range extension is more than 2 times the Initial Range and the Initial Balance is typically smaller than the normal day but higher than the trend day.
Trend day is an imbalanced profile that’s controlled by the long term participants. As soon as market opens, they begin to push prices into direction an continue for the remainder of the day. These trends are cause by long term participants stepping in. Other market participants have no options other than aligning in the direction of a longer timeframe. This tends to open up a range far exceeding the averages in recent days which in turn results in short term participants getting blown out.
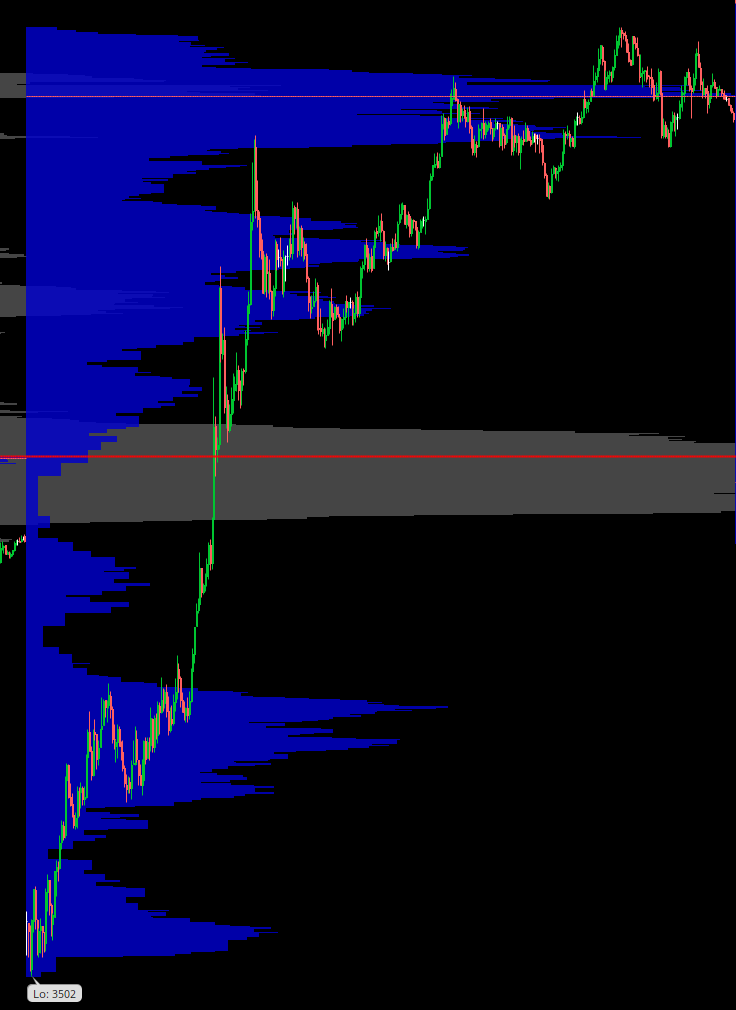
Double Distribution is an imbalanced profile that has two nodes as price rotates away from short term participants in the IB to new value by long term participants. Then, the larger timeframe traders take control and drive the price in one direction. In the later session, another price rotation happens at the other side of the edge (2nd Balance Region). Both the price rotation regions should be separated by single prints. Risk-Reward Ratio is typically higher for a day trader during Double Distribution Days.
Neutral Day Center has a balanced profile with a smaller range than a Normal day. This happens because both long term buyers and long term sellers are prevalent. They don’t trade directly each other but the intraday trader will act as a mediator between both the larger time-frame buyer and seller. Range Extension happens on both the sides (i.e., Initial Balance Breaks out on both the sides). First half will slow and choppy with low volume but the second half will be taken over with larger size orders and price finally manages to close around the center of the profile.
Neutral day extremes aren’t very common but do happen most frequently during event driven days. This is when both long term buyers and long term sellers step in to contain prices at the extremes. Initial balance breaks out on both the sides, but price managed to close at the one side of the day’s extreme.
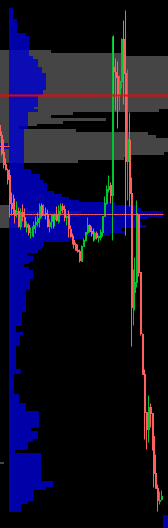
P Profile looks exactly like a P, IB begins with buyers driving prices higher which IB range will not be touched the rest of the day. As market moves higher long term sellers step in but are met by buyers not far from the profile high. Value builds in this range EOD showing clear rejection of prices at lows
b Profile looks exactly like a B, IB begins with sellers driving prices lower which IB range will not be touched the rest of the day. As market moves lower long term buyers step in but are met by sellers not far from the profile low. Value builds in this range EOD showing clear rejection of prices at lows.
Look at each of these over many times and understand the meaning of Profile structure. This is how overtime you will be familiar with what may come next and what that will look like for it to happen. That understanding can result in creating trade setups that best fit you as everyone will like different setups.
Timeframes to use on profiles
Swing Timeframes it would be best to use at least 90 days of profiles with up to 360 days depending on where the prices line up relative to the past. On all my trades whether its Intraday, Swing, Long term investing, I will have one Profile that shows every day on my chart combined. So, for example, using a 90-day timeframe (swing) I will map out all my levels based on the entire 90-day profile. Looking for the best areas of interest on a longer timeframe. Some traders use separate profiles but, in my experience, it has not provided higher accuracy with levels. To add, if you are on a 90-day timeframe and price is currently at the high of the overall profile. I will then zoom out more to 180-360 days to map out where the next area of interest will be. Same goes for when price is at the low of the overall profile. Keep note of this so you can have the best results and a system that can be repeated.
Long term Timeframes use at least 360 days on overall profile to see how value has formed throughout the last year. Applying same system as Swing Timeframe for mapping out levels while keeping in account you have picked a stock or Future that will continue in the direction of your trade over months span.
Intraday Timeframe use a 15-day overall profile while applying same system of zooming out when the profile doesn't fit in range of levels. On top of this I also will add a 5-day (weekly) profile to see how value shifts throughout the weeks. This is another way to gauge overall trend and where to place yourself in the market.
My Favorite setup to trade
This is one of a few of my favorite setups to trade and will be one that is used every week whether trading Futures/ Stocks. Spotting my own VAH & VAL in HVN while shorting VAH & longing VAL. Both tend to set targets at the POC but is subject to change based on overall profiles structure. Note this is for Intraday Timeframes but can be applied to all 3 listed above. The reason I like this setup, which day in day out it works with little downside, is it's not complicated to follow and generally keeps you on the right side of the market on a day-to-day basis. Time to dive into why this setup works...
More times than not the market will be in balance jumping in between prices. This setup is based on these balance areas using my own VAL + VAH for levels that offer least downside risk. Nearly all wins will be 3:1 risk reward at the minimum giving you an edge where you can lose 3 trades and win one and be breakeven still. Risk Reward is how traders gauge how big the win will be relative to the loss. Only take trades that will make a minimum of 2 times the amount the loss would result in. For example, if my LIS is 15 points from my Entry then my Target needs to be at least 30 points out with an ideal target of 45 points out. To be a profitable trader all you need is a 50% win rate and 2:1 risk reward. That recipe will result in a net positive P/L.
Entry & Exits are solely based on the meaning of the profiles structure. VAH is Entry for Shorts as its where sellers defend value lower and buyers step aside opening a move back to most common traded price in that profile, the POC. When going long it's the opposite with buyers stepping in and defending higher prices while sellers’ step aside resulting in move back to POC. POC most common used target for this setup but if volatility is expected then I will expand target to other side of value area or beyond to the next HVN VAL. All depends on current market conditions which is something all traders need to keep in account as you can be blindsided in a second then underwater.
Avoid after hours Profiles (Mine are RTH Only)
In my system, ETH is avoided completely in terms of my profiles do not contain any volume from ETH. Institutions are trading during cash session unless a major event is going on and even then, they will come to trade the next day. Sometimes I will swing or trade OVN but it's very rare. So, in this instance I only want to see the volume for the RTH sessions as that's what my system will be trading. Now if I were to place a trade OVN I would either use the same RTH levels or use new ones, but it still will only be on RTH Profiles.
How to Practice Volume Profile
There are many platforms to use to view Volume Profile but not all of them allow market replay/ on demand. If using a platform that allows this, then I recommend mapping out Daily Plans for each session just like I do on twitter. Play out the day in fast forward or even get extra practice by taking paper trades and logging the results in a journal. Overtime you will see months of price action form and build up muscle memory of what volume profile levels are the most potent. Doing this will make tremendous progress in learning Orderflow while also bringing many new systems that best suits you. There is no holy grail in trading or with Orderflow. It's a powerful tool that when learned can result in the highest performing results. The key is sticking with it overtime and pushing yourself to learn what it has to offer.
Data Fees and Exchanges to use
Every exchange and broker you use will be different from one another, make sure to see what the data fees are if any to use Volume Profile. Luckily TD Ameritrade - Thinkorswim has Volume Profile and On Demand for free. Research what platforms you like best and pick what suits you. Mine is not even close to looking like the setup my mentor had but I found great success with the profiles used in the examples throughout this.
Hope everyone enjoys this post and can now be equipped with the basics on Volume Profile. Stay tuned for Daily Videos coming showing how I pull all my levels and analyze market structure. Looking forward to the Future!
- Flint
BTW- Cant wait to start reading about DOM! Understand the principal, but looking forward to seeing the implementation and execution.
Thanks flint . awaiting for DOM and especially learn how to execute trades for various profiles with proper risk management . Although have the daily levels facing execution issues . Would be really helpful , at some point ,if you could do live session /share your thoughts on how to identify setups ,execute and risk manage them . Appreciate your help.