


The Week in Review
We have a phenomenal week to recap. As we posted on Sunday, our primary objective was to be long at the 6854 Value Area Low. Early in the week, we saw a gap up going into Monday’s session that sparked a massive 100-handle rally all the way up to the 7000 milestone. By Wednesday, reflecting on the current trend and how far the market had pulled away from the 10-week moving average, we looked for a sell-off back toward that mean for those looking to deploy new longs—resulting in a precise 65-handle drop.
Going into Thursday, we marked 6966 as the Value Area High (VAH) for the week. The market failed to budge higher, providing seven distinct selling opportunities of 10-15 handles each time sellers hit the bid. Finally, for Friday’s session, we correctly called for lower unemployment data. When it arrived, we saw the break over 7000 to hit new weekly highs.
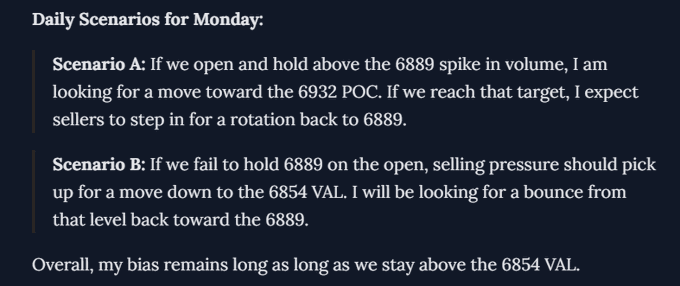
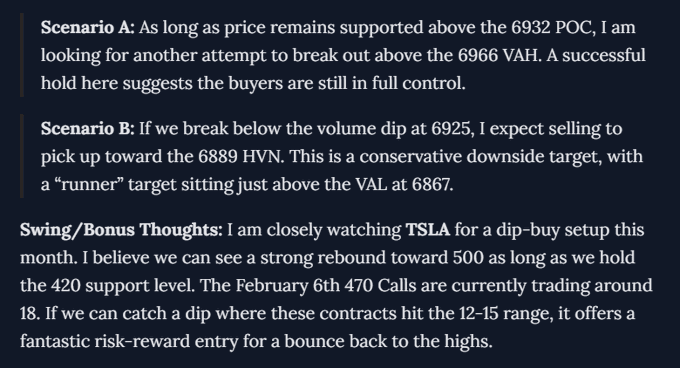
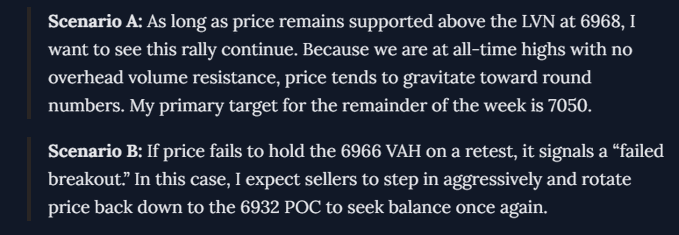
Here’s screenshots right out of the Daily Plans from last week:


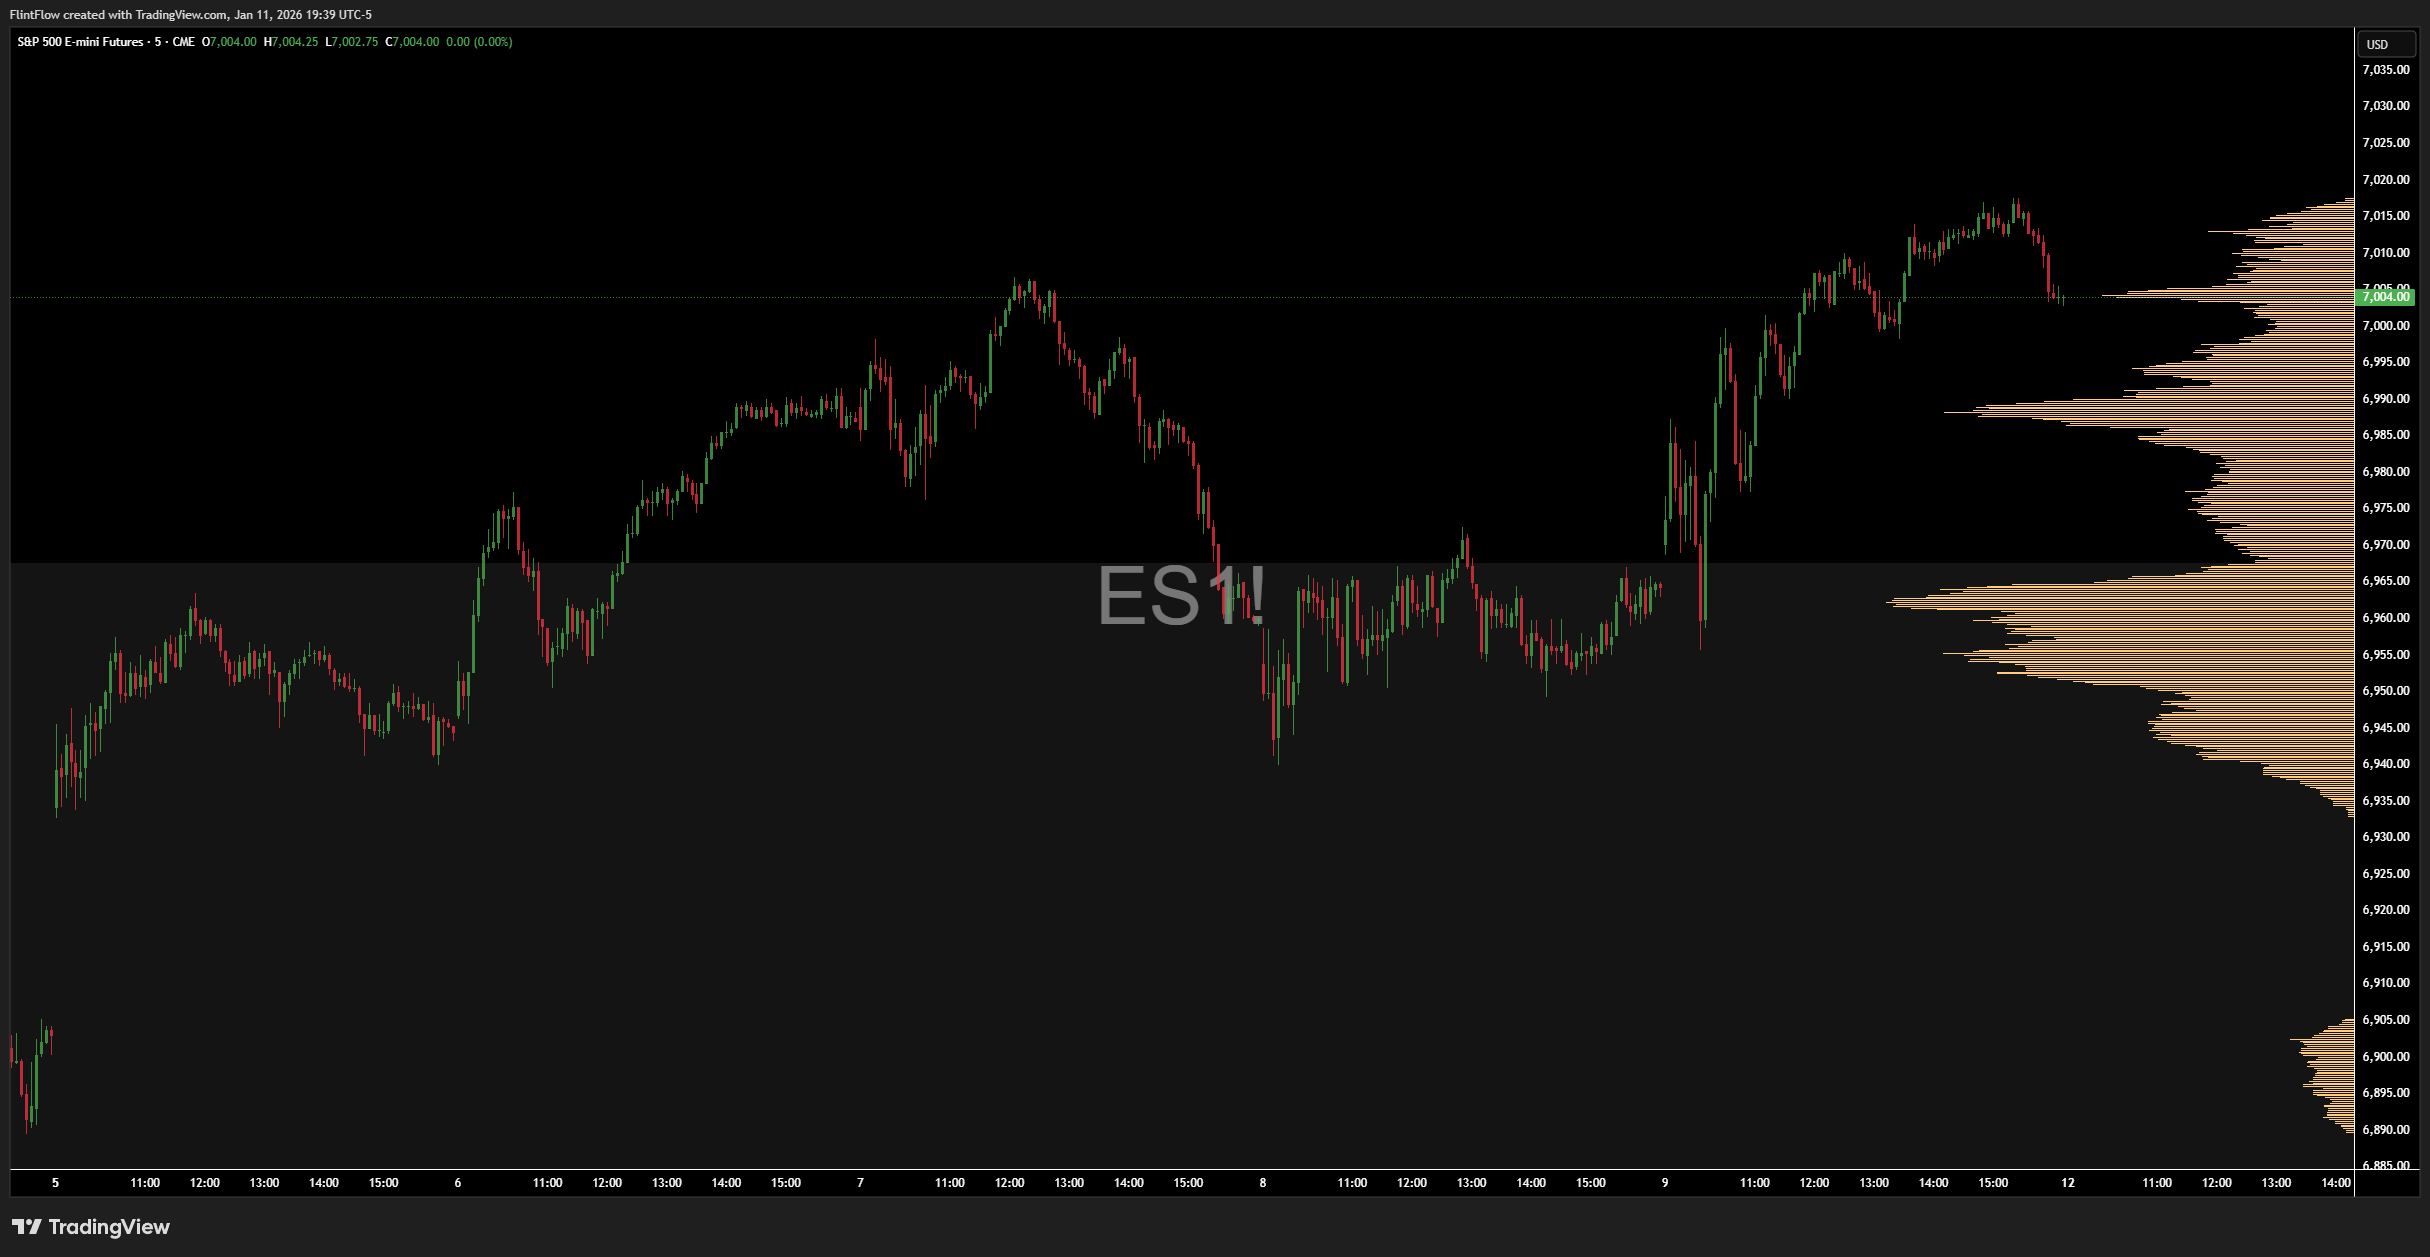
Here’s a chart of last week for reference:
Beyond the index, we called support at 420 on Tesla, which saw a weekly low of 425 before a sharp 25-handle bounce back toward 450. While some played this with commons, I posted an exclusive call for subscribers on the Feb 6th 470 Calls. The goal was to snag these in the $12.00–$15.00 range as price hit support; they dipped below 12 before recovering back over 15. We expect continuation for both the market and TSLA this week.
Last week solidified the importance of Volume Profile and high-timeframe trend levels, like moving averages and value areas. While the S&P 500 hit all-time highs, the NASDAQ showed to be clearly weaker, failing to reach its own record. This is due to tech revenue concerns as companies pour CapEx into AI without immediate returns. We are seeing a healthy shift out of AI and into a broader market, which is reflected in our watchlist outperforming by a massive margin.
A vital lesson for amateur traders: stop “averaging down” on losers. Many traders buy one block and then add as the stock drops, turning small losses into account-killers. In our watchlist, your portfolio could be up 15.22% just by allocating 5% to each position. Out of 12 stocks, only one (FRO) hit a stop. Our biggest gainer, CBLL, is up 94.09%. By pyramiding (adding to winners) rather than losers, you can turn a 15% gain into a 30-50% gain while keeping your risk lower than when you started.
To dig deeper into this concept, make sure to check ou the educational post sent out yesterday:
How to Size for Winners and Losers
Now let’s dive into this weeks analysis.
The Big Picture (Macro)
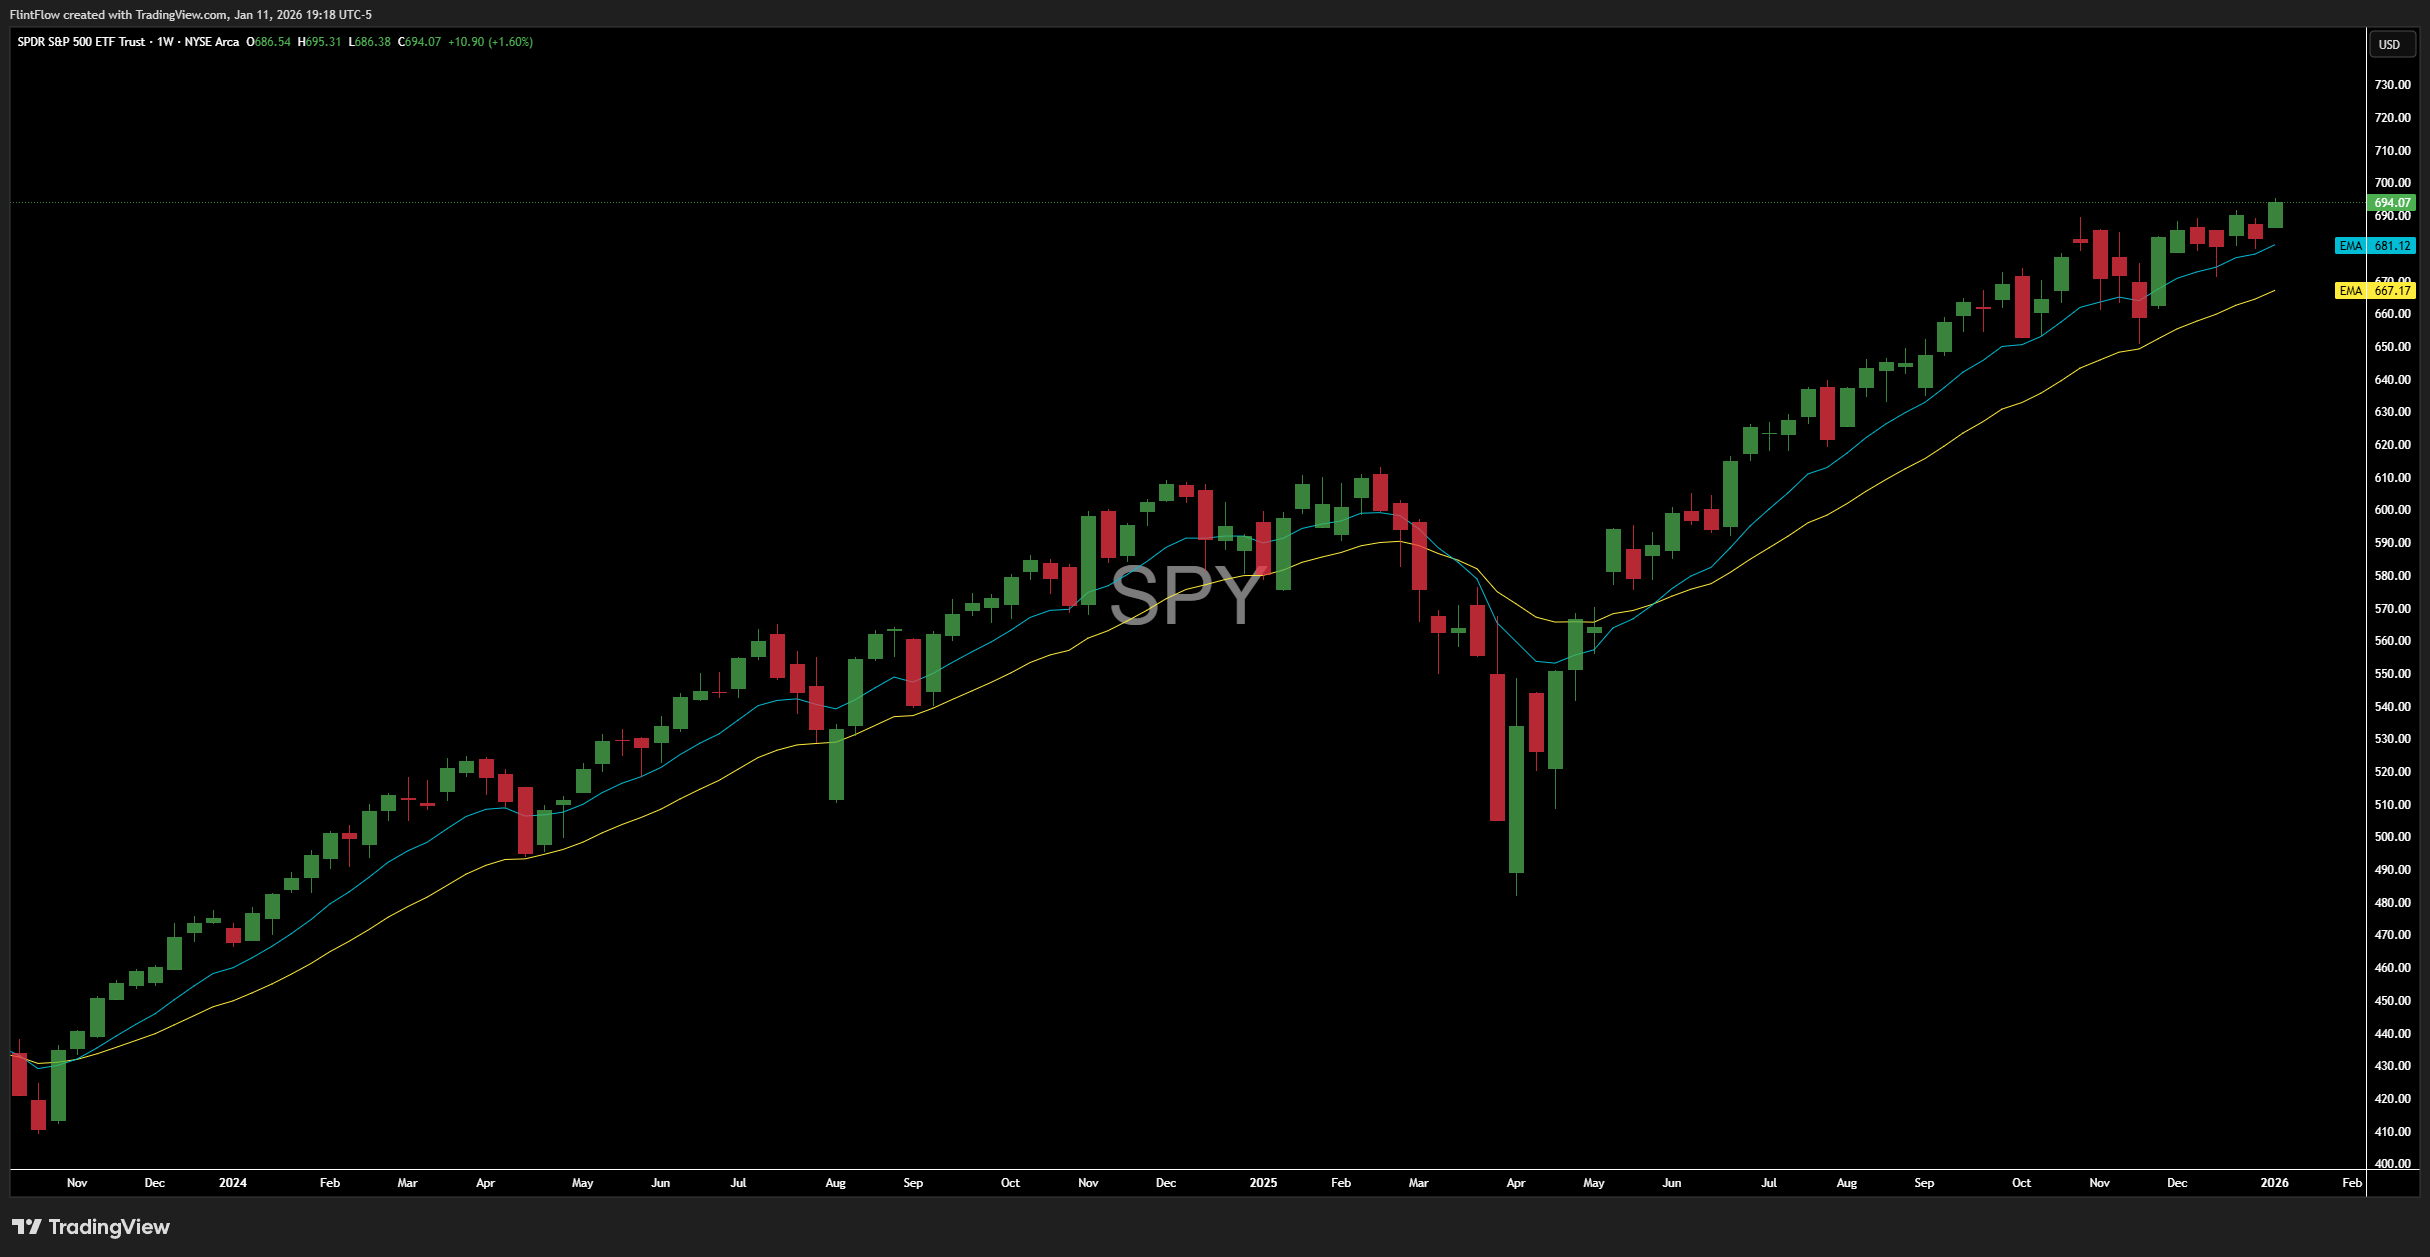
The broader trend for the S&P 500 (SPY) remains firmly bullish. We are holding weekly closes above both the 10-week and 21-week EMAs. As long as the 10-week EMA (currently 681.12) holds on a closing basis, the path of least resistance is up. If we were to lose that level, I’d expect a swift 115-handle move down to the 21-week EMA at 667.17.
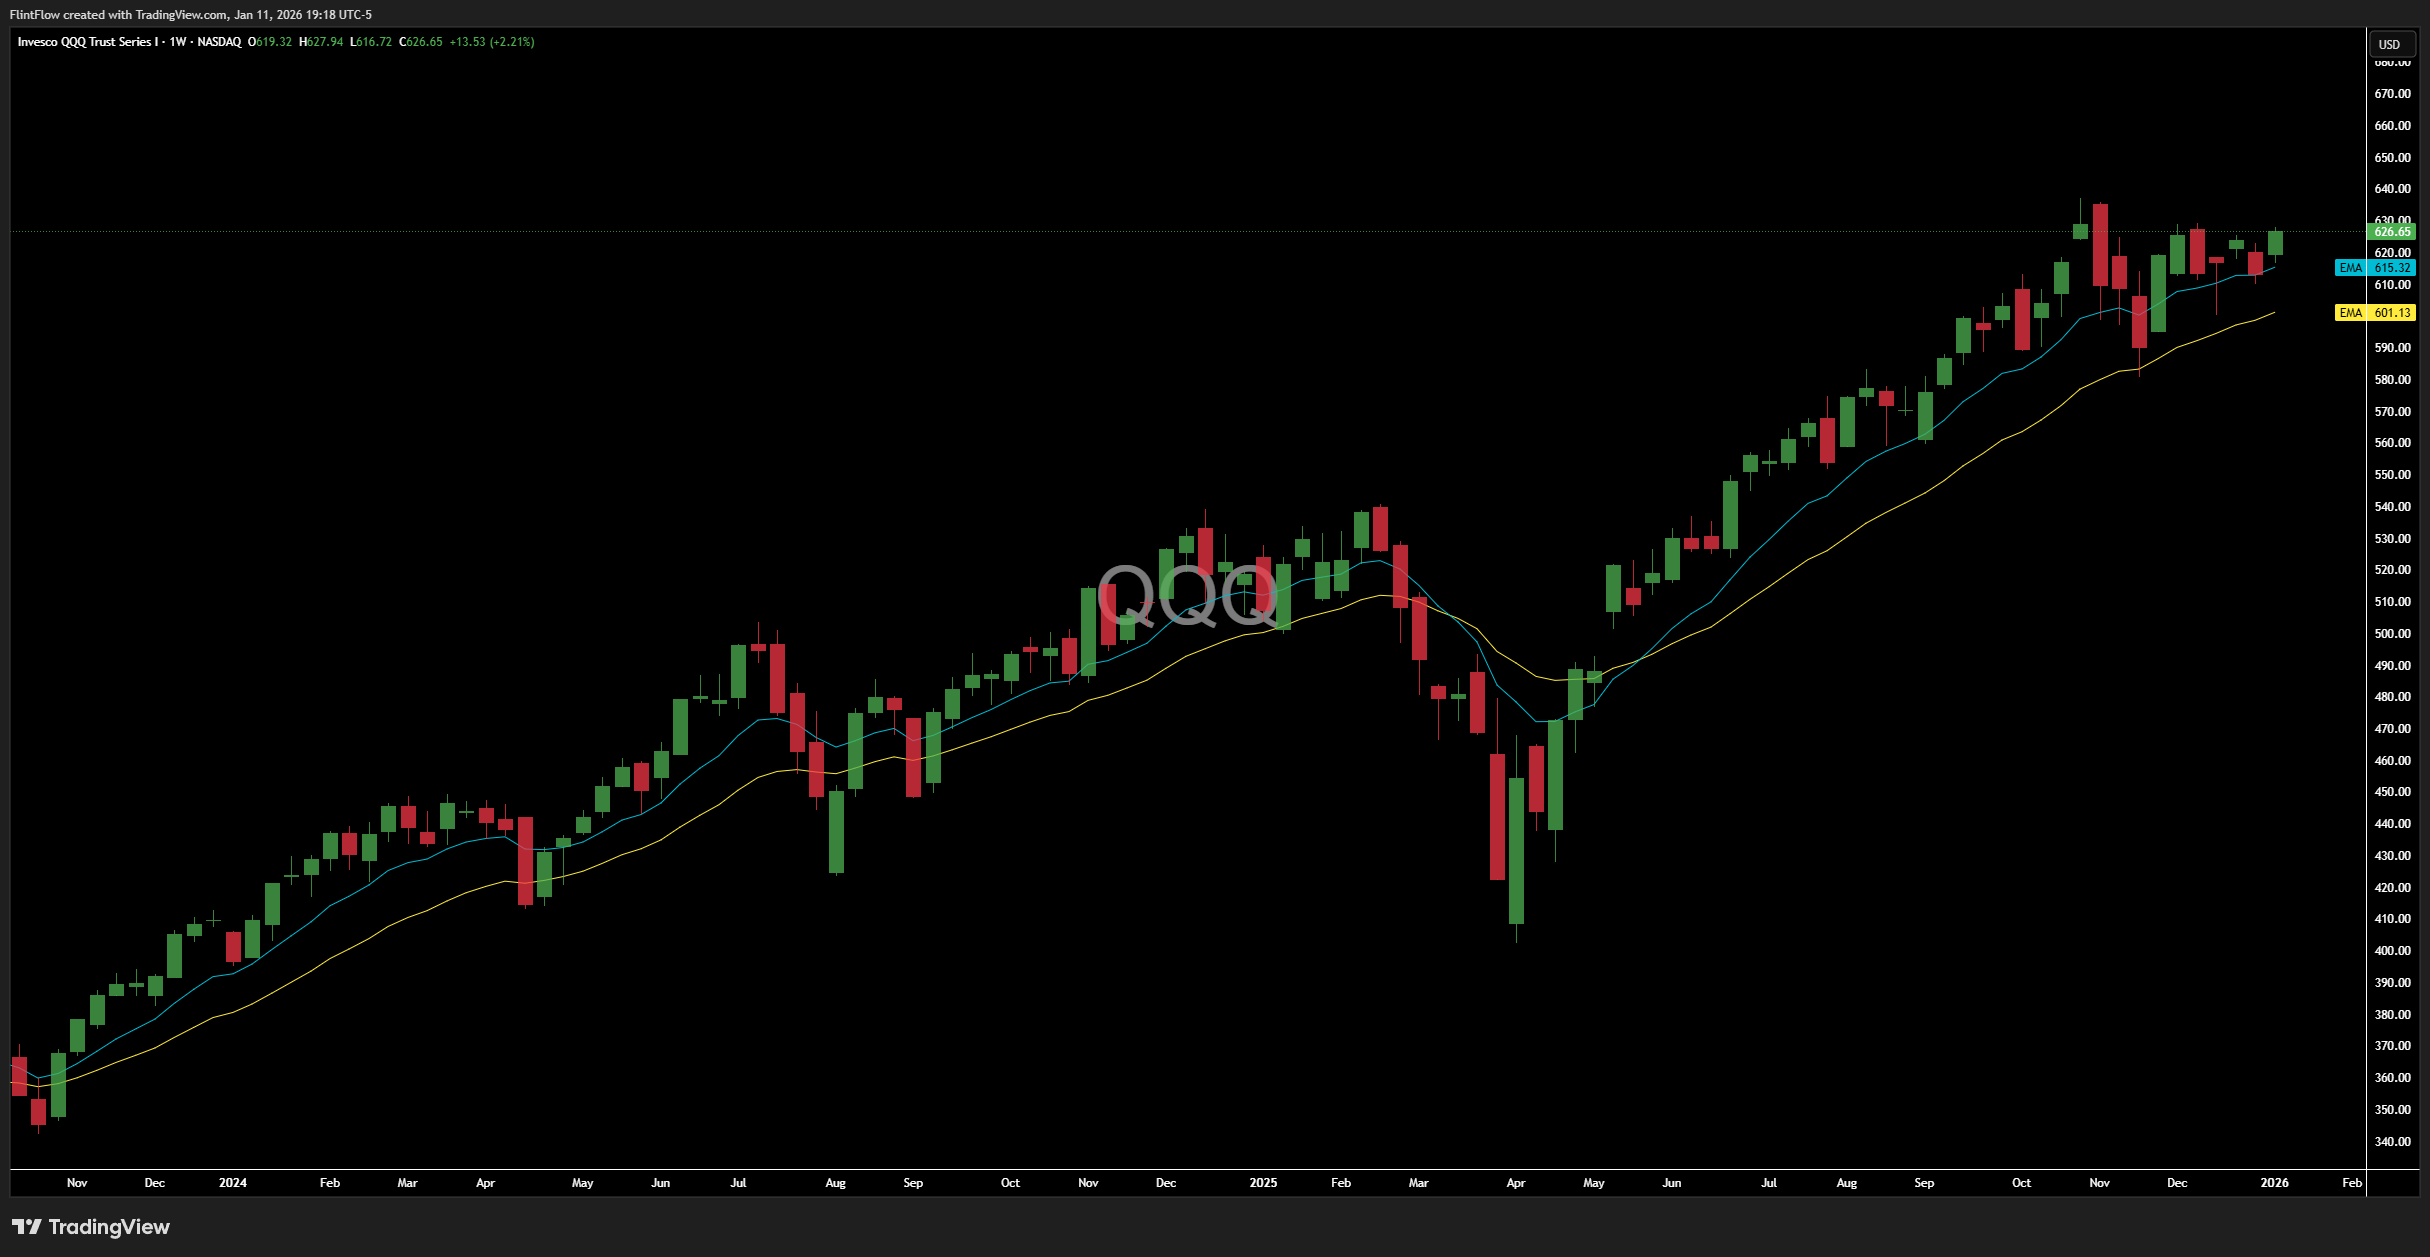
The NASDAQ (QQQ) mirrors this setup but with slightly more volatility. It is also holding above its 10-week EMA (615.32) and 21-week EMA (601.13). Tech remains in an uptrend, but be aware that a weekly close below the 10-week EMA would open the door for a much sharper correction—potentially 460 handles—down to the 21-week EMA. For now, the “buy the dip” regime is still in effect.
The Economic Calendar
Monday: None.
Tuesday: Inflation Rate (CPI) — This will dictate interest rates for the rest of the fiscal year.
Wednesday: Producer Price Index (PPI) — Secondary confirmation on inflation trends.
Thursday: None.
Friday: None.
The Weekly Map (Paid)
Major Weekly Levels:
