


Welcome back everyone!
To initiate this weekly edition of the Flow State series, we will review the past week and compare the posted observations with the results of the S&P.
Two major levels were significant last week: the 6797 Value Area Low (VAL) and the 6908 Value Area High (VAH). Both of these levels precipitated substantial moves, ultimately defining the weekly high and low. Another key level was the developing Point of Control (POC), which served as the primary target area for both long and short positions. As a reminder, the POC represents the price level with the highest traded volume, often acting as a magnet for price. A move away from either the VAL or VAH typically tends to gravitate back toward the POC.
In every instance, when the price surged to the 6908 VAH or sold off to the 6797 VAL, it subsequently reverted directly to the POC. Furthermore, we even observed price movements spanning from one side of the value area all the way to the other. For Volume Profile traders, this pattern represents a textbook trade setup.
The market typically balances for 70% to 80% of every session, meaning that utilizing Volume Profile will clearly delineate where these areas of balance are likely to form. Once a breakout or breakdown occurs, one can then integrate my established approach for trending markets. I have previously published a detailed thread on this topic on X, which you can find here: Volume Profile Thread
Back to my thoughts from the previous week.
Every Weekly and Daily Plan will always outline two scenarios. Clearly marking the areas where buyers are in control and the area where shorts are. In the previous week, we anticipated balance, as the size of the value area exceeded 100 handles. For a breakout or breakdown, we were more favorable towards a sell below the Value Area Low (VAL), a scenario which did not materialize. However, the weekly close occurred at the lower extreme of the value area. Take a look at the two scenarios that were presented in last week’s edition:
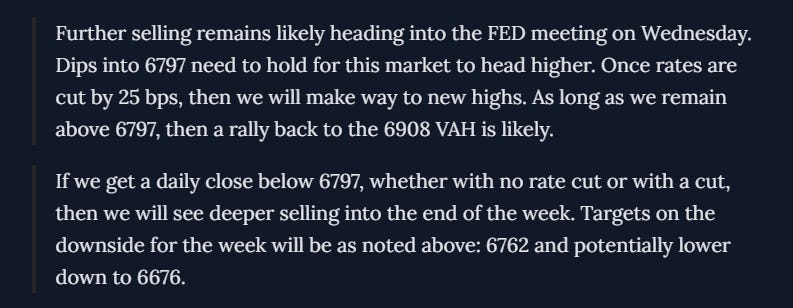
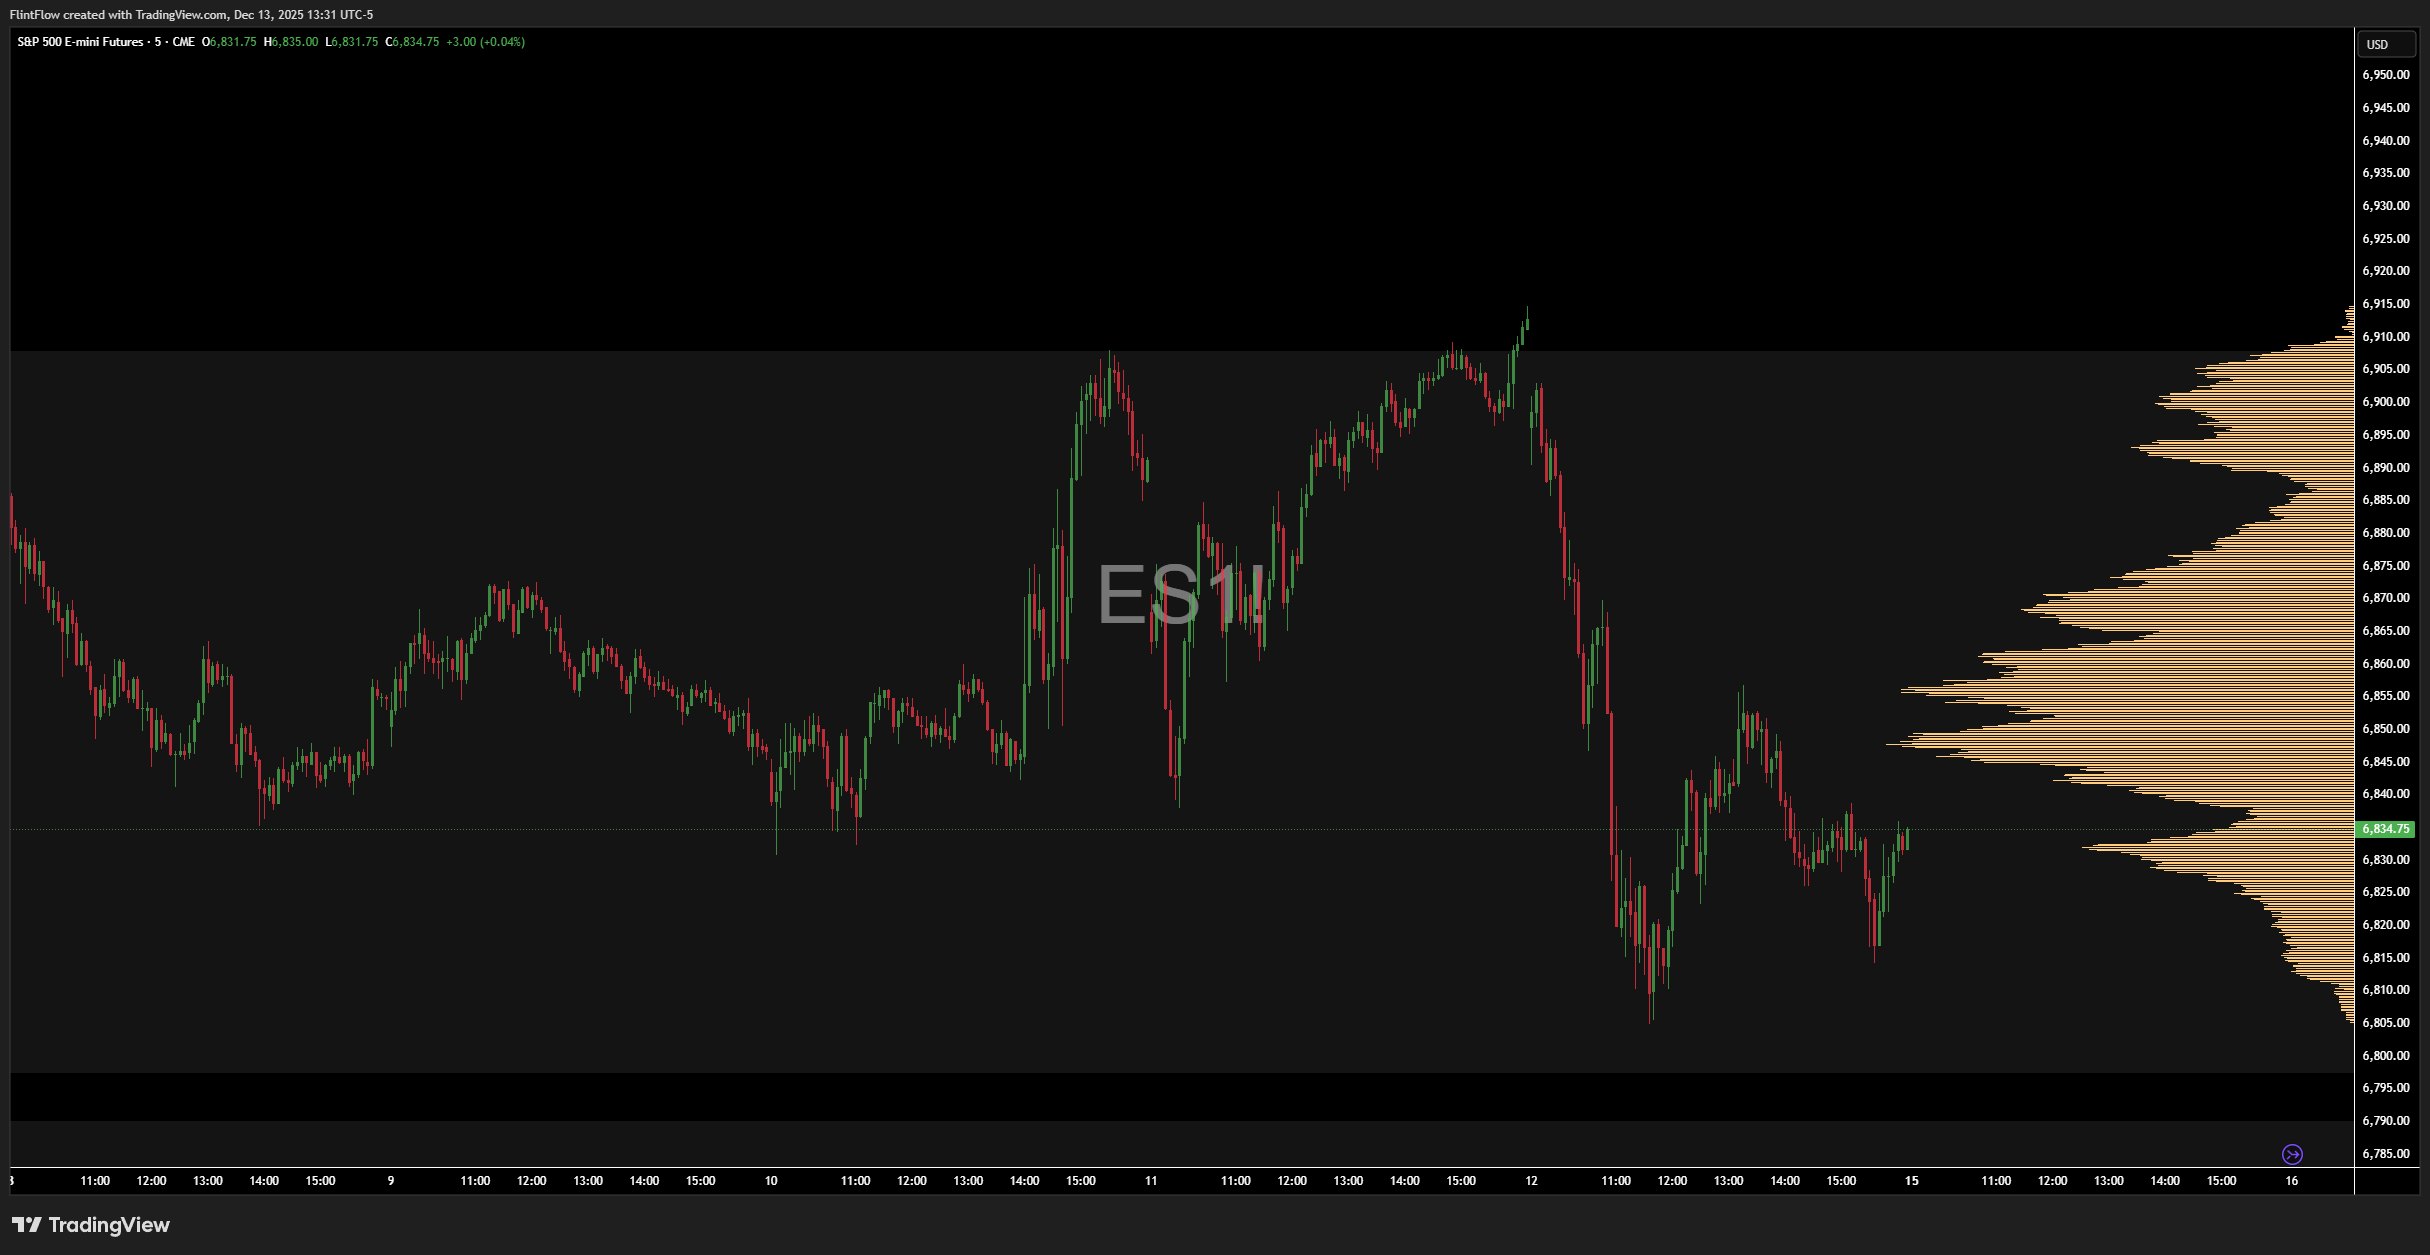
Initially, I had anticipated a dip into the Value Area Low (VAL) leading up to the interest rate decision, but the price remained contained within the large High Volume Node (HVN) for nearly three sessions. Once the decision was released, we saw a move upward to the 6908 Value Area High (VAH), which established the high of the day. The price then subsequently sold off by 92 handles, nearly reaching the VAL. Following this decline, a sharp bounce occurred, returning the price directly back up to the 6908 VAH.
During Friday’s session, we once again witnessed a strong sell-off from the 6908 VAH, which set a new weekly low with a total sell of 103 handles. The 6797 VAL represents a critical support level for buyers; a break below the current value area, which has been held for the past two weeks, is the undesirable outcome for bullish momentum. From this point, the price rebounded directly to the 6856 Point of Control (POC), bringing in a gain of 51 handles.
Here’s last weeks chart:
Before moving into my thoughts for this week, I do want to cover some thoughts for all the new catalysts.
The Good:
The biggest thing that happened was the Fed meeting. Everyone expected it, and they delivered: another interest rate cut, the third one in a row, settling the main rate between $3.50% and $3.75%.
Stocks loved it. The S&P 500 and the Dow briefly shot up to new records. The sectors that thrive on cheaper money, like banks (Financials) and smaller companies (Small-Caps), really benefited.
The Bad:
Right after the Fed, the reality of the AI spending frenzy hit. This is what we were talking about before—companies spending billions on AI infrastructure but not showing the profits yet.
The big drops came from Oracle and Broadcom. Oracle essentially told everyone, “We’re spending a crazy amount of money (Capex) on AI,” but their revenue wasn’t exciting enough to back it up. Broadcom, even though their AI chip sales were good, couldn’t keep the momentum because the market is suddenly questioning the timeline for these massive investments to actually pay off.
This caused panic selling in the tech giants—the Nasdaq got hammered. Money rotated out of expensive AI stocks and into more stable parts of the market like Industrials and certain Financials, causing the overall S&P 500 to give back most of its early gains.
So, in short, The Fed gave the market a boost, but a serious problem on AI spending ended up leaving S&P a bit flat by Friday.
For perspective, the S&P closed the week down -0.8% while the Nasdaq finished -2.2%.
Heading into the week ahead, several key economic data points are scheduled for release. On Tuesday, we anticipate the highly awaited Unemployment Rate report. Furthermore, on Thursday, we will receive the latest Inflation data, which is currently projected to show a 3.2% year-over-year reading.
Before proceeding to the technical levels for the upcoming week, I want to point out that no new stocks presented robust setups for my watchlist. The stocks previously posted are performing great, and I will continue to update those accordingly. At this time, there is no reason to issue a update to the watchlist. Should the market offer another stock, an updated analysis will be sentnext week.
Now let’s dive into the current market structure.
For the most part, the key levels from last week remain consistent, although slight adjustments have been made to the Value Area Highs and Lows.
We will focus on the following three Value Areas for the month. Please note that these levels are subject to weekly review and change:
VAL 6797 - VAH 6908
VAL 6734 - VAH 6790
VAL 6608 - VAH 6730
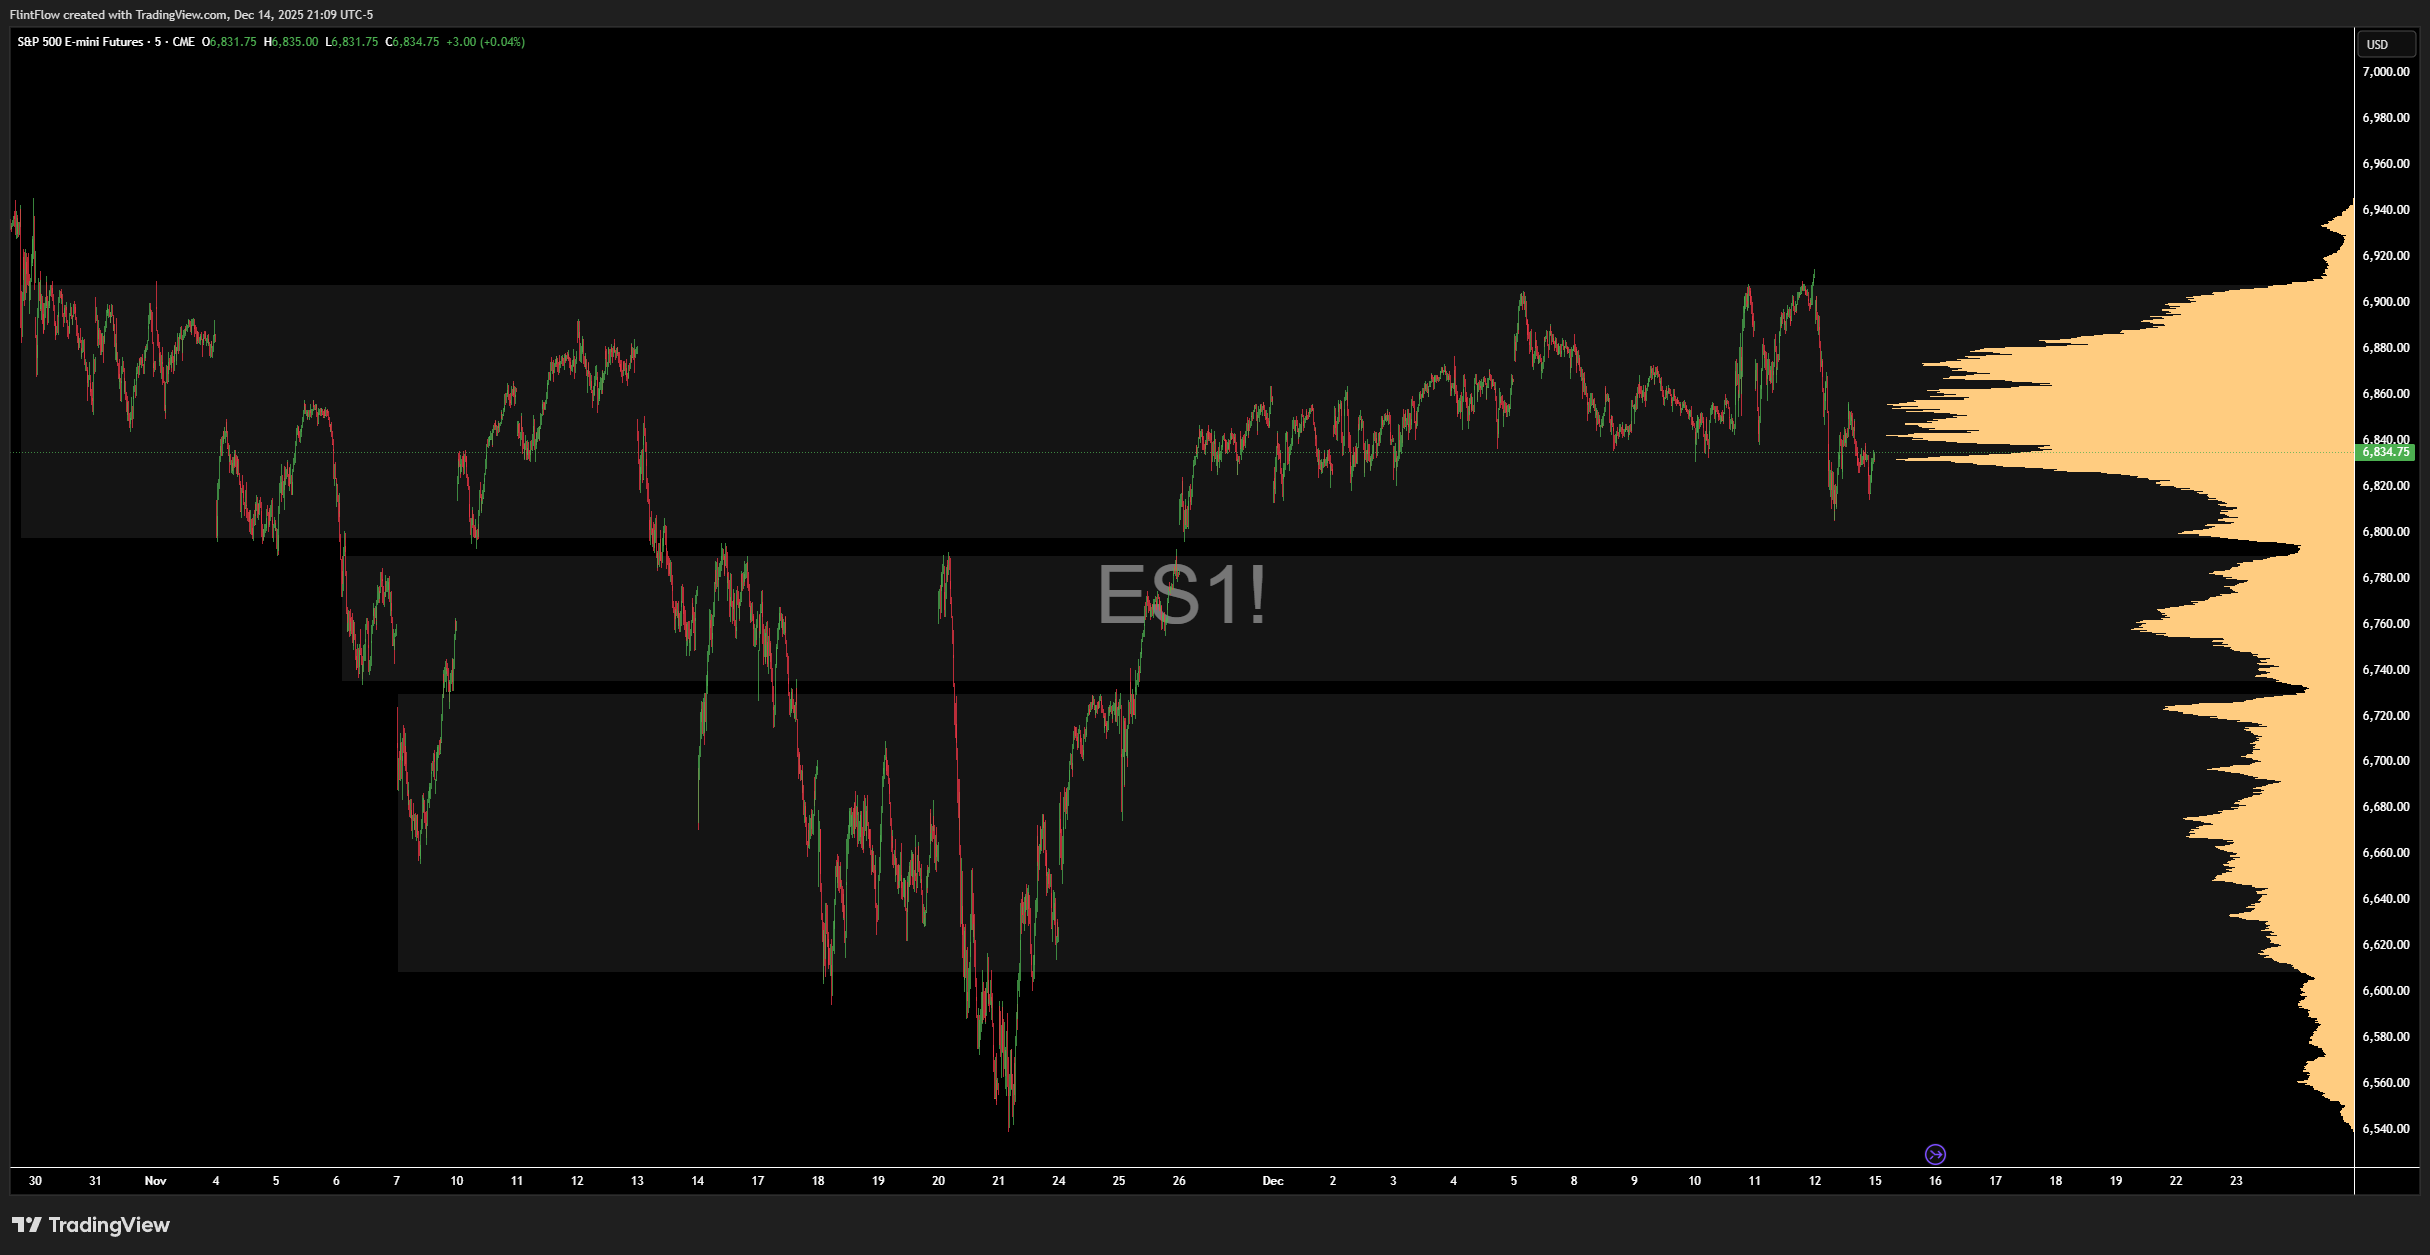
Price is currently positioned within the upper value area and is contained by the large High Volume Node (HVN) spanning from 6827 to 6880. With high certainty, we can anticipate a choppy week as long as the price remains confined within this node.
The optimal scenario for long positions would be a rebound off the 6797 Value Area Low (VAL) or a decisive breakout above the 6908 Value Area High (VAH). For a lower-probability setup, initiating long positions near the lower boundary of this HVN at 6827 could bring a bounce up toward the 6856 Point of Control (POC). The inverse logic applies to short positions: a setup near the upper boundary of the High Volume Node at 6880 could lead to a retracement back down to the 6856 POC.
Numerous scenarios could unfold during the week, but the primary level of focus will once again be the 6797 VAL. While the price remains above this level, we should anticipate rallies up to 6880.
For a downside scenario, our attention shifts to the second value area, which is 6734 to 6790, with its POC situated at 6758. The main target for a bearish move will be the 6758 POC, with the potential for continuation down to the 6734 VAL.
My expectations for the week:
As long as price remains above 6797, then we can expect a rally up to 6880.
Downside risk comes once below the 6793 LVN. On a break through this we should see a sell to the 6758 POC. If price continues down to the 6734 VAL then this is an attractive area for a bounce back up to the 6790 VAH.
That’s all for my thoughts on the week ahead. If you enjoyed this post then feel free to drop a like and comment.
Disclaimer
General Risk Disclosure: Trading in the stock market involves substantial risk and is not suitable for every investor. The valuation of stocks may fluctuate, and as a result, clients may lose more than their original investment. The impact of seasonal and geopolitical events is already factored into market prices. The highly leveraged nature of stock trading means that small market movements will have a proportionally larger impact on your traded funds, and this can work against you as well as for you.
No Guarantee of Accuracy: The information provided in this newsletter is obtained from sources believed to be reliable and accurate; however, Flint Research does not guarantee its accuracy or completeness. The views, opinions, and analyses expressed herein are provided as general market commentary and do not constitute investment advice.
No Investment Recommendations or Professional Advice: Flint Research is not a registered investment advisor or broker-dealer. The content provided in this newsletter is for informational purposes only and should not be construed as investment advice. It does not constitute an offer or solicitation to buy or sell any securities or to adopt any investment strategy. Any decisions made based upon the information provided in this newsletter are the sole responsibility of the reader. We recommend that you seek advice from a qualified professional advisor before making any investment decisions.
Past Performance Not Indicative of Future Results: Past performance of a security or market is not necessarily indicative of future trends. Historical data should not be relied upon as a prediction of future market movements.
Regulatory Compliance: Flint Research complies with all applicable laws and regulations, including those set forth by the U.S. Securities and Exchange Commission (SEC). We are committed to maintaining the highest standards of integrity and professionalism in our relationship with you, our client.
Conflicts of Interest: Flint Research and its staff may hold positions in the securities mentioned in this newsletter. These positions can change at any time.
Use of the Newsletter: The information provided in this newsletter is intended solely for the personal, non-commercial use of its subscribers. Redistribution of this newsletter in any form is prohibited without the express written consent of Flint Research.
Any chance you can provide a link or guide tinget the right volume setup in TradingView?