Welcome back everyone!
This week, we are focusing on a critical area of interest for market bulls, which will be detailed in the sections below. When a market trends, as outlined in my post "Introduction to Volume Profile," you can observe what a trend day session entails. We treat this trend as if it were represented by daily candles. The goal is to observe value accumulation, ensuring it remains supported at the bottom, then pushes to a high, thereby creating new, higher value. When I mention "new value," it's important to understand that these price levels may have been traded previously. My analysis uses the profile of the current trend, focusing on the range from recent lows to the most recent highs. I aim to observe the development of value, while also taking note of major Points of Control (POCs) identified in the past. The current trend is particularly significant in guiding our analysis throughout the week. As value continues to build towards higher levels, we anticipate a break of the upper value area when considering short positions. For a significant sell-off to occur, we look for a break in a large value area. This analysis is conducted daily and can be visualized in a subsequent section, where I map out the current trends for ES, NQ, CL, GC, and NG. This process is also applicable to stocks, provided they are liquid enough to exhibit clear value building, and are minimally affected by price manipulation, such as pump-and-dump schemes.
For those who haven't yet read "Introduction to Volume Profile," I strongly recommend doing so, as it forms the basis for most of these daily and weekly analyses.
Another aspect I wish to highlight is the importance of currency correlations.
Correlations
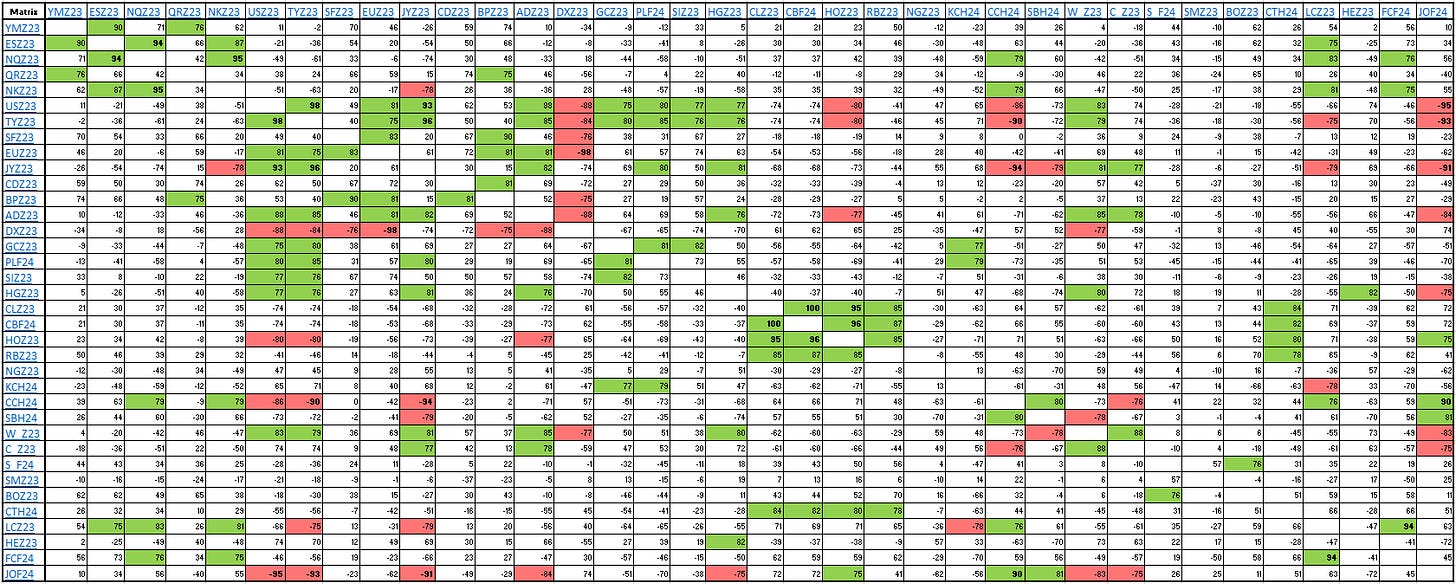
I have developed a currency correlation matrix, updated with data from the past five years. This matrix reveals the positive or negative correlations among various currencies. A notable example is my analysis of long positions in the Canadian Dollar, Swiss Franc, and Japanese Yen, which coincided with a decline in the USD, bolstering these positions. The matrix helps identify which currencies are likely to yield a positive return based on historical trends (over the last five years) when moving in the opposite direction. When considering a position, it's crucial to focus on these correlations to determine if a currency will work for or against your position. For instance, simultaneously longing the USD and the Japanese Yen, given their historical relationship, would typically result in one performing well while the other falters. In such cases, it's advisable to limit your position to just one currency. If you're considering positions in two positively correlated currencies, consider reducing the size of each position to half, as one might perform better than the other. This strategy allows you to capitalize on both opportunities. The same logic applies if you're planning to long one currency and short another with a negative correlation: place half size in both, treating it as a single trade.
When you identify two trades with neutral correlation, this indicates that you can safely allocate full size to both positions, as they are unlikely to negatively impact each other's returns.
What defines a positive correlation?
A correlation above 0.75 is considered positive and is highlighted in green.
What is considered neutral?
Correlations ranging from -0.74 to 0.74 are deemed neutral and are marked in white cells.
What signifies a negative correlation?
A correlation below -0.75 is considered negative, indicated by red shading.
This methodology is also applicable to indices across all markets, as shown below. Soon, I plan to create an extensive matrix that combines all markets, as understanding these correlations is crucial for optimal risk management. This approach is valuable across all timeframes, and I encourage expanding your knowledge of correlations as much as possible. The indices data, presented below, currently covers the last 180 days, but I intend to update it to encompass the last five years. This will provide more accurate data for correlating currencies with indices.
Furthermore, this approach can be applied to all asset classes!
Now, let's dive into my thoughts for the upcoming week.


