


Welcome back, everyone.
The unfolding of the geopolitical tension between the US and Iran is underway. Based on the recent weekly close on the S&P and Nasdaq we had anticipated an escalation of this over the weekend or next week. Within 24 hours the US under went strikes on Iran taking out the supreme leader. While we can’t predict what the US or Iran will do next, we can have an idea of what has already happened and what sectors are going to see changes.
The escalation of conflict between the US and Iran represents the most potent source of market volatility this week due to its immediate and profound impact on global energy supply chains. Because the global economy is still sensitive to inflationary pressures, any threat to the free flow of oil through the Middle East sends shockwaves through the futures markets. This specifically centers on the Strait of Hormuz, a narrow chokepoint through which approximately one-fifth of the world’s liquid petroleum passes daily. Even the threat of a blockade or military skirmishes in this region adds a significant geopolitical risk premium to crude prices, which in turn raises input costs for almost every other sector of the economy.
When energy prices spike unexpectedly, it creates a “twin-threat” for equity markets. First, it acts as a tax on the consumer, reducing discretionary spending power as gasoline and heating costs rise. Second, it complicates the mission of the Federal Reserve; if high energy costs keep inflation metrics above target, the Fed may be forced to keep interest rates higher for longer, even if the broader economy begins to slow. This fear of “stagflation”—stagnant growth combined with high inflation—is exactly what causes institutional investors to pull back from stocks and move toward defensive positions.
Beyond the direct economic impact, this conflict triggers a psychological shift in the market known as a “flight to quality.” During periods of high-intensity military tension, the standard correlation between assets often breaks down. Investors reflexively sell “risk-on” assets, such as technology stocks and high-yield corporate bonds, and pivot into “safe havens” like gold, the US Dollar, and Treasury bonds. This rotation happens rapidly and can lead to sharp, intraday drops in the S&P 500 and Nasdaq.
Now this is all of the knowns as of right now so now we will shift our focus to the unknown.
The potential future paths of this tension could play out as follows:
The most immediate path involves a transition from targeted air strikes to a full-scale maritime blockade. While the Strait of Hormuz is technically an international waterway, Iran could utilize “gray zone” tactics—such as sea mines, drone swarms, or fast-attack craft—to make the passage uninsurable. If major insurance providers continue to pull coverage, as seen in the last 24 hours, the strait becomes closed for all practical purposes. This would force the US to initiate large-scale naval escort operations, a move that historically leads to direct, high-intensity naval skirmishes.
A second path involves the “Axis of Resistance” proxies expanding the theater of war. If the Iranian leadership feels cornered, they may activate sleeper cells or proxy groups like Hezbollah and the Houthis to launch synchronized attacks on US bases in Qatar, Bahrain, and Kuwait. Such an expansion would turn a localized conflict into a regional one, forcing the US to choose between de-escalation or a broader campaign that includes ground-level targets across multiple borders. This scenario creates the “prolonged uncertainty” that markets fear most.
Lastly, there is the risk of a domestic command-and-control collapse within Iran. With reports of significant hits on Iranian leadership infrastructure, there is a distinct possibility of “rogue” commanders acting without central authority. In this “use it or lose it” scenario, localized military units might launch ballistic missile barrages simply because they have lost contact with a central command. This unpredictability makes it nearly impossible for global markets to price in a “ceiling” for the conflict, as there is no single entity to negotiate an off-ramp with.
The fallout from these escalation paths is not distributed evenly. While the overall market may see a broad sell-off, these specific sectors are in the direct line of fire:
Airlines and Tourism: This sector is facing a dual crisis. The closure of Middle Eastern airspace—particularly the hubs in Dubai, Abu Dhabi, and Doha—has already led to thousands of cancellations. Rising jet fuel prices, which are gapping higher this morning, will immediately crush the profit margins of global carriers like United, Delta, and Lufthansa.
Automotive and Manufacturing: Modern car production relies on “just-in-time” supply chains. With the Strait of Hormuz effectively blocked, the delivery of specialized plastics, rubber, and petrochemical feedstocks is being halted. Analysts estimate that a sustained disruption could increase vehicle production costs by 15% to 25% due to the surge in raw material prices.
Technology and Growth: This sector is highly sensitive to interest rates. If energy-driven inflation remains “sticky,” the Fed will be unable to cut rates as planned. This puts immense pressure on high-valuation tech stocks, which are already reeling from the broader “risk-off” sentiment.
Consumer Discretionary: As oil prices head toward $100 per barrel, it acts as a global tax on consumers. Retailers like Target, Best Buy, and Nike will likely see a sharp drop in demand as households redirect their spending toward essential energy and food costs.
Heading into March, we are in a tough spot as the broader market rallies while tech has seen the most selling. With tech in a risk-off phase and the rest of the market now approaching that territory, we are setting up for a sharper move to the downside. The companies that have outperformed are now on the radar to feel the impact of inflationary pressures. As we all know, any increase in prices will, without a doubt, be passed on to consumers. Furthermore, the Fed will likely be stuck holding rates until Iran backs down.
The remarkable part of all this is that you would be on the right side of the move if you simply followed the moving averages. For weeks, we have called for further selling, and it now appears we are over 200 handles off the highs on the S&P and 2,000 handles on the Nasdaq.
In addition to this warning, we called for broader weakness in the tech sector as the implications of AI become clearer. The time will come when we flip back to being overall bullish, but that time is not now.
We will now pivot to the Economic Calendar for the week.
Economic Calendar
Monday: Manufacturing PMI
Tuesday: None.
Wednesday: Services PMI
Thursday: None.
Friday: Unemployment Rate
While we usually pay close attention to any changes in this data, the recent catalyst involving the US and Iran carries far more weight. Investors will now pay attention to the impacts of this data after the fact, rather than before. Inflation is setting up to move back up, so these data points are going to see complete shifts compared to what we will see this week.
S&P and Nasdaq Trends
SPY
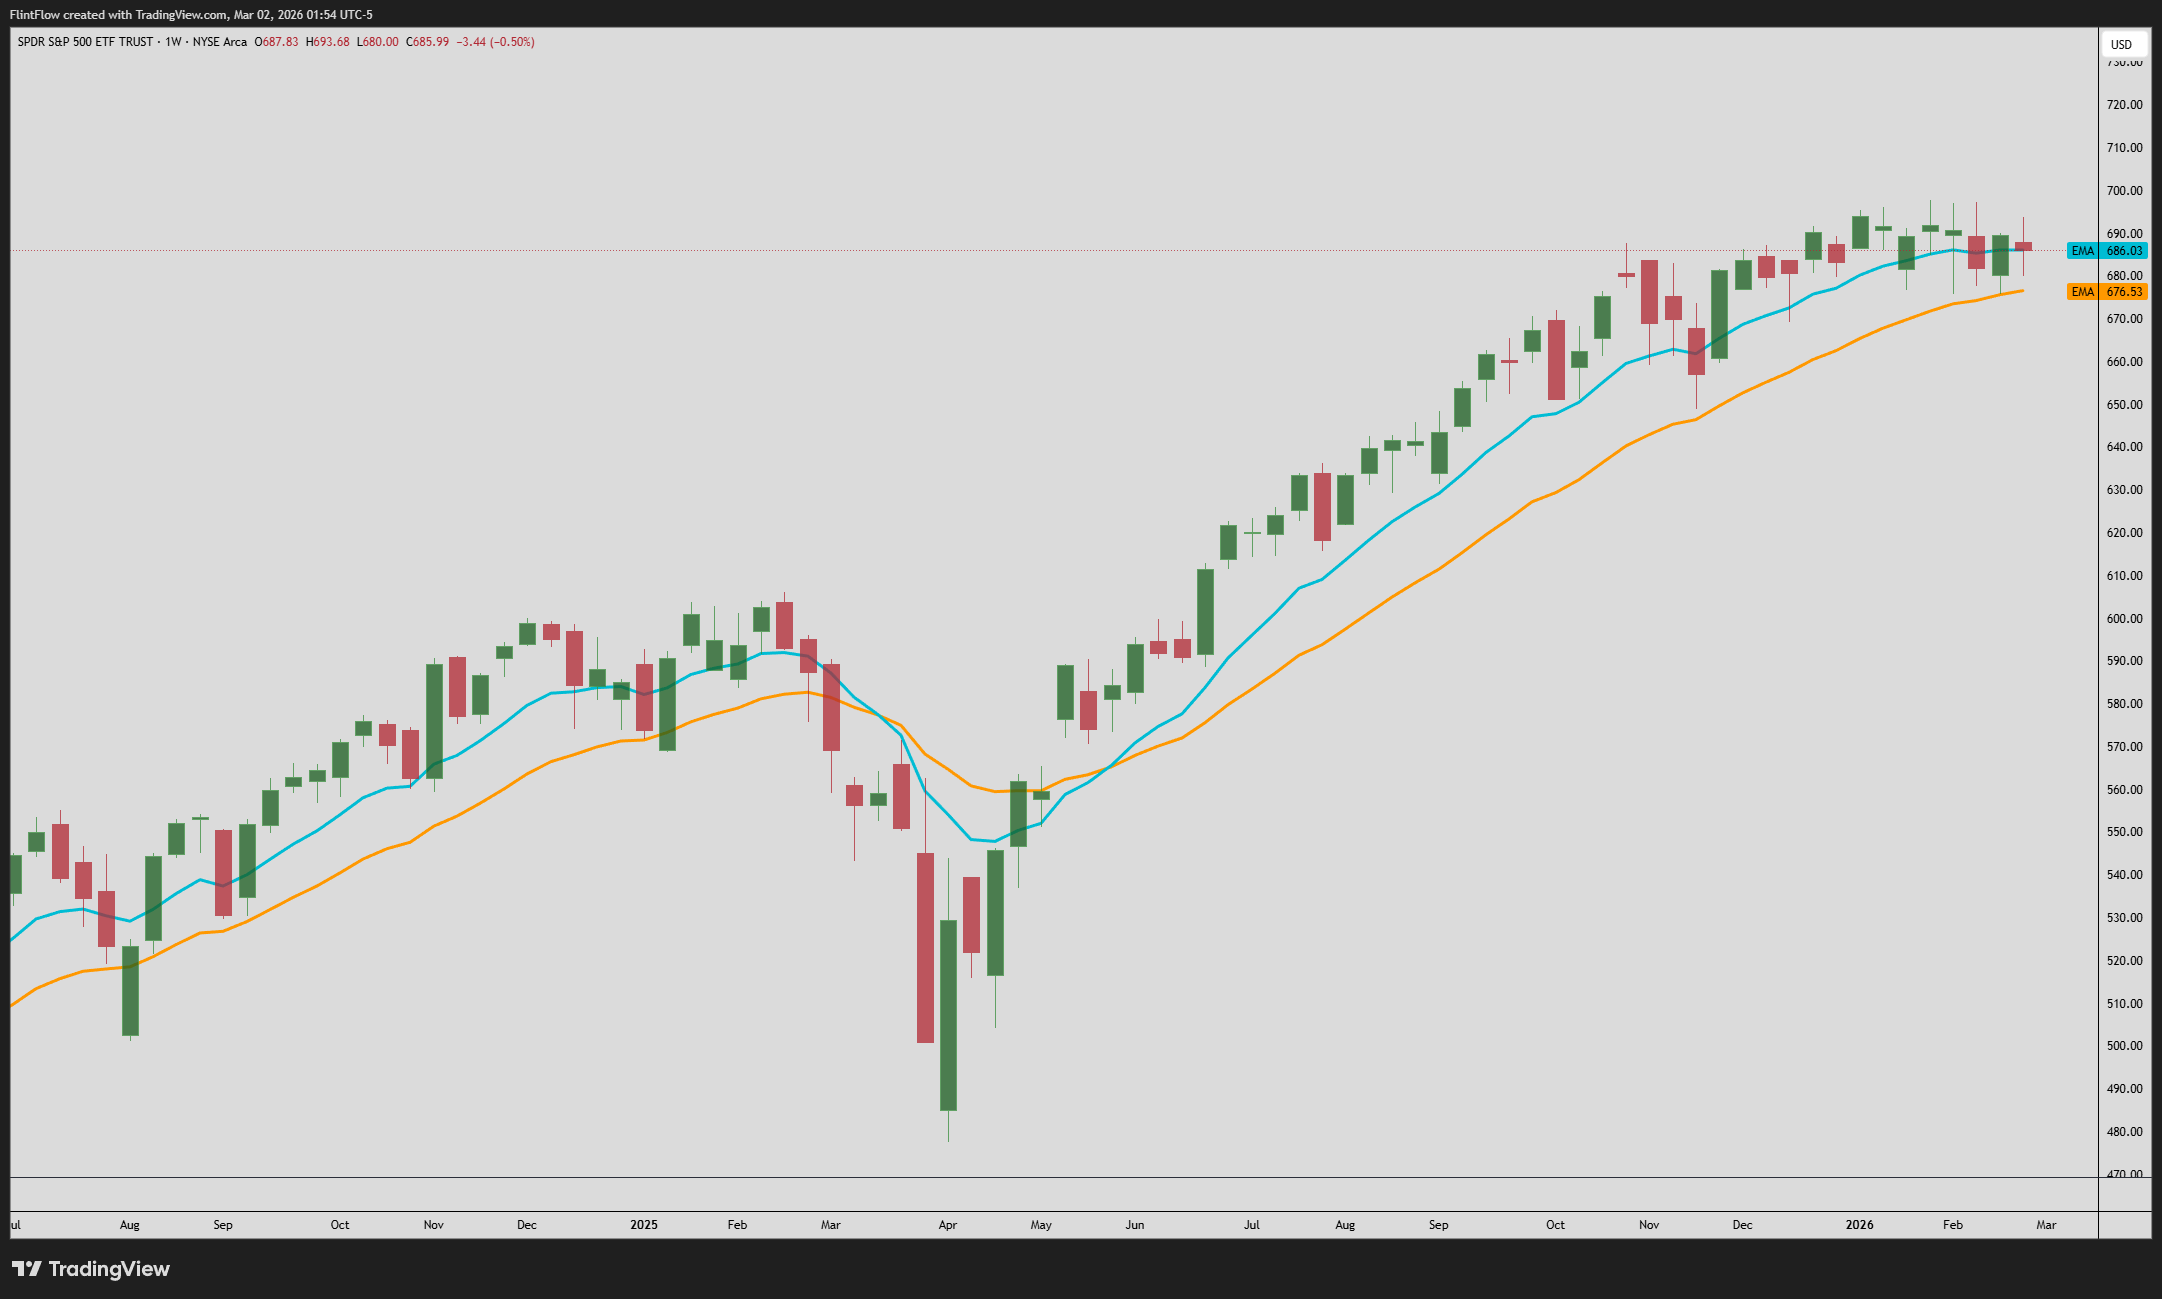
The SPY is once again in a position where I will be prepared for a rejection at the 10-week moving average, with plenty of room to move down toward the 21-week EMA. Every single time we have broken below this 10-week moving average, we have seen a sharp retracement toward the 21-week EMA.
Therefore, heading into this next week, we want to see another retracement down to the 21-week EMA, which currently sits at 676.53. I anticipate further selling will break below the 21-week EMA and continue toward new lows. We could expect a target down to 649.32, which was the swing low set during the week of November 17, 2025.
QQQ
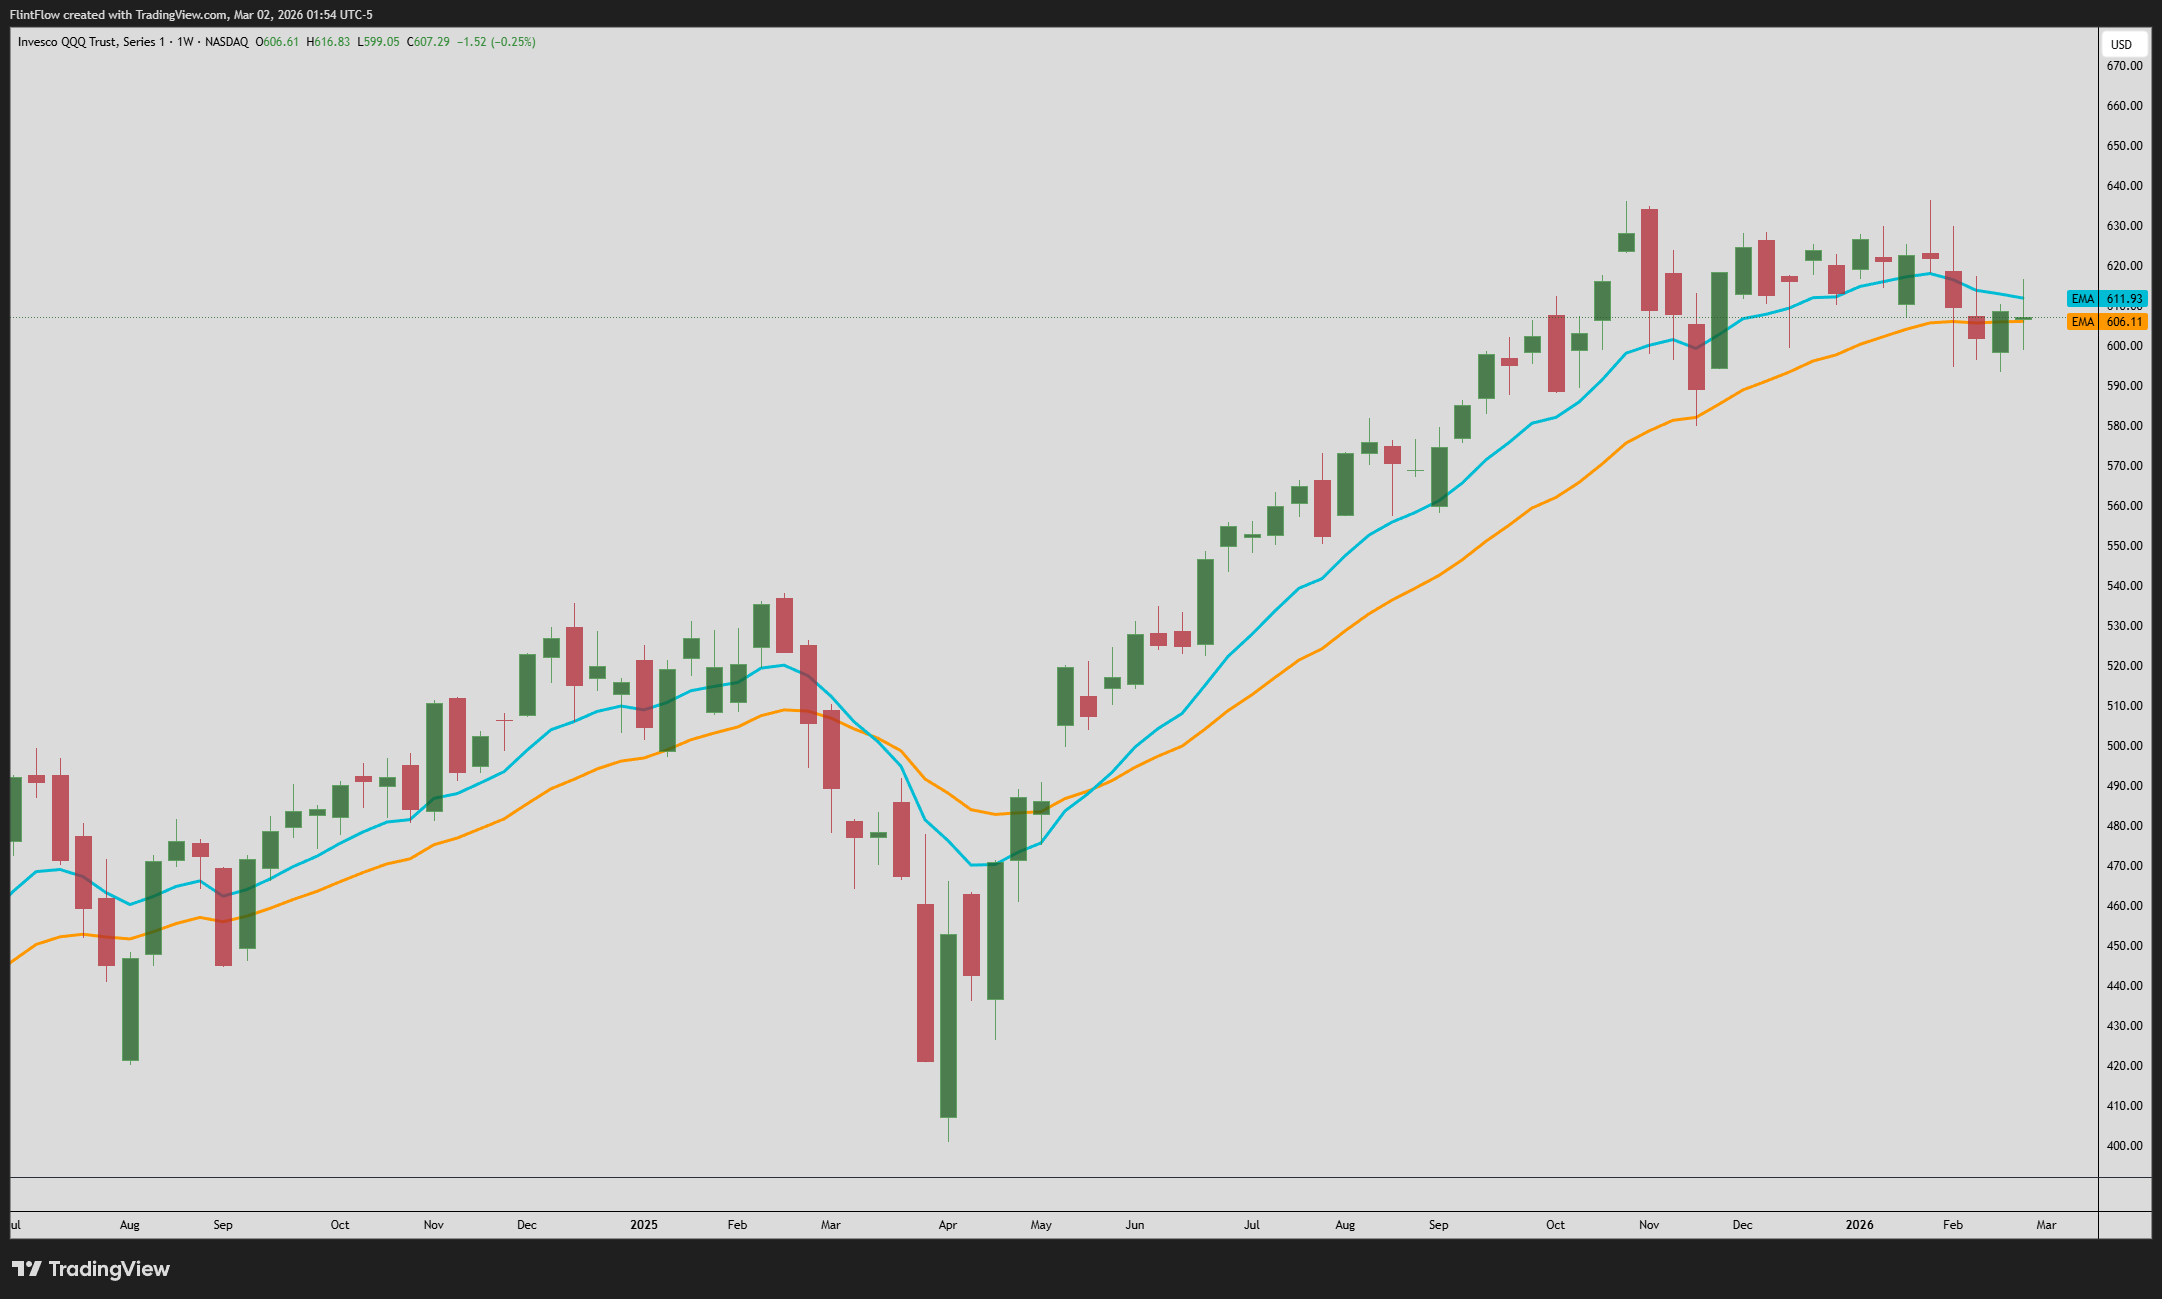
Last week we saw a shocking turn as the NASDAQ was holding well below both the 21-week EMA and the 10-week EMA. The interesting part was the sharp rebound at the end of the week, which actually closed the price just above the 21-week EMA.
Heading into this next week, given the recent news regarding the US and Iran, I expect we could see resistance form at this 21-week EMA, which is currently at 606.11. From there, we could expect a strong sell-off toward the recent lows of 580.39, set on November 17, 2025.
This concludes the breakdown of both the S&P and NASDAQ recent trends, as we maintain an overall bearish outlook heading into the week. We will now shift our focus to the S&P levels for the weekly and daily timeframes using the volume profile.
S&P Levels
With the recent gap down into the Sunday session, we saw a move right down to the value area low at 6802.
This level is a key support for the week, as it represents the value area low (VAL) of the largest value area from the last few months. The market has remained relatively supported above this level during the last four major dips. If you are looking for a place to hold longs this week, you ideally want price to remain above this 6802 level. As long as we hold here, I expect a retrace back up to the 6889 point of control (POC), with a continuation higher toward the 6968 value area high (VAH). If we fail to break below this major VAL, we could very well see a medium-term low form as the market moves back toward all-time highs.
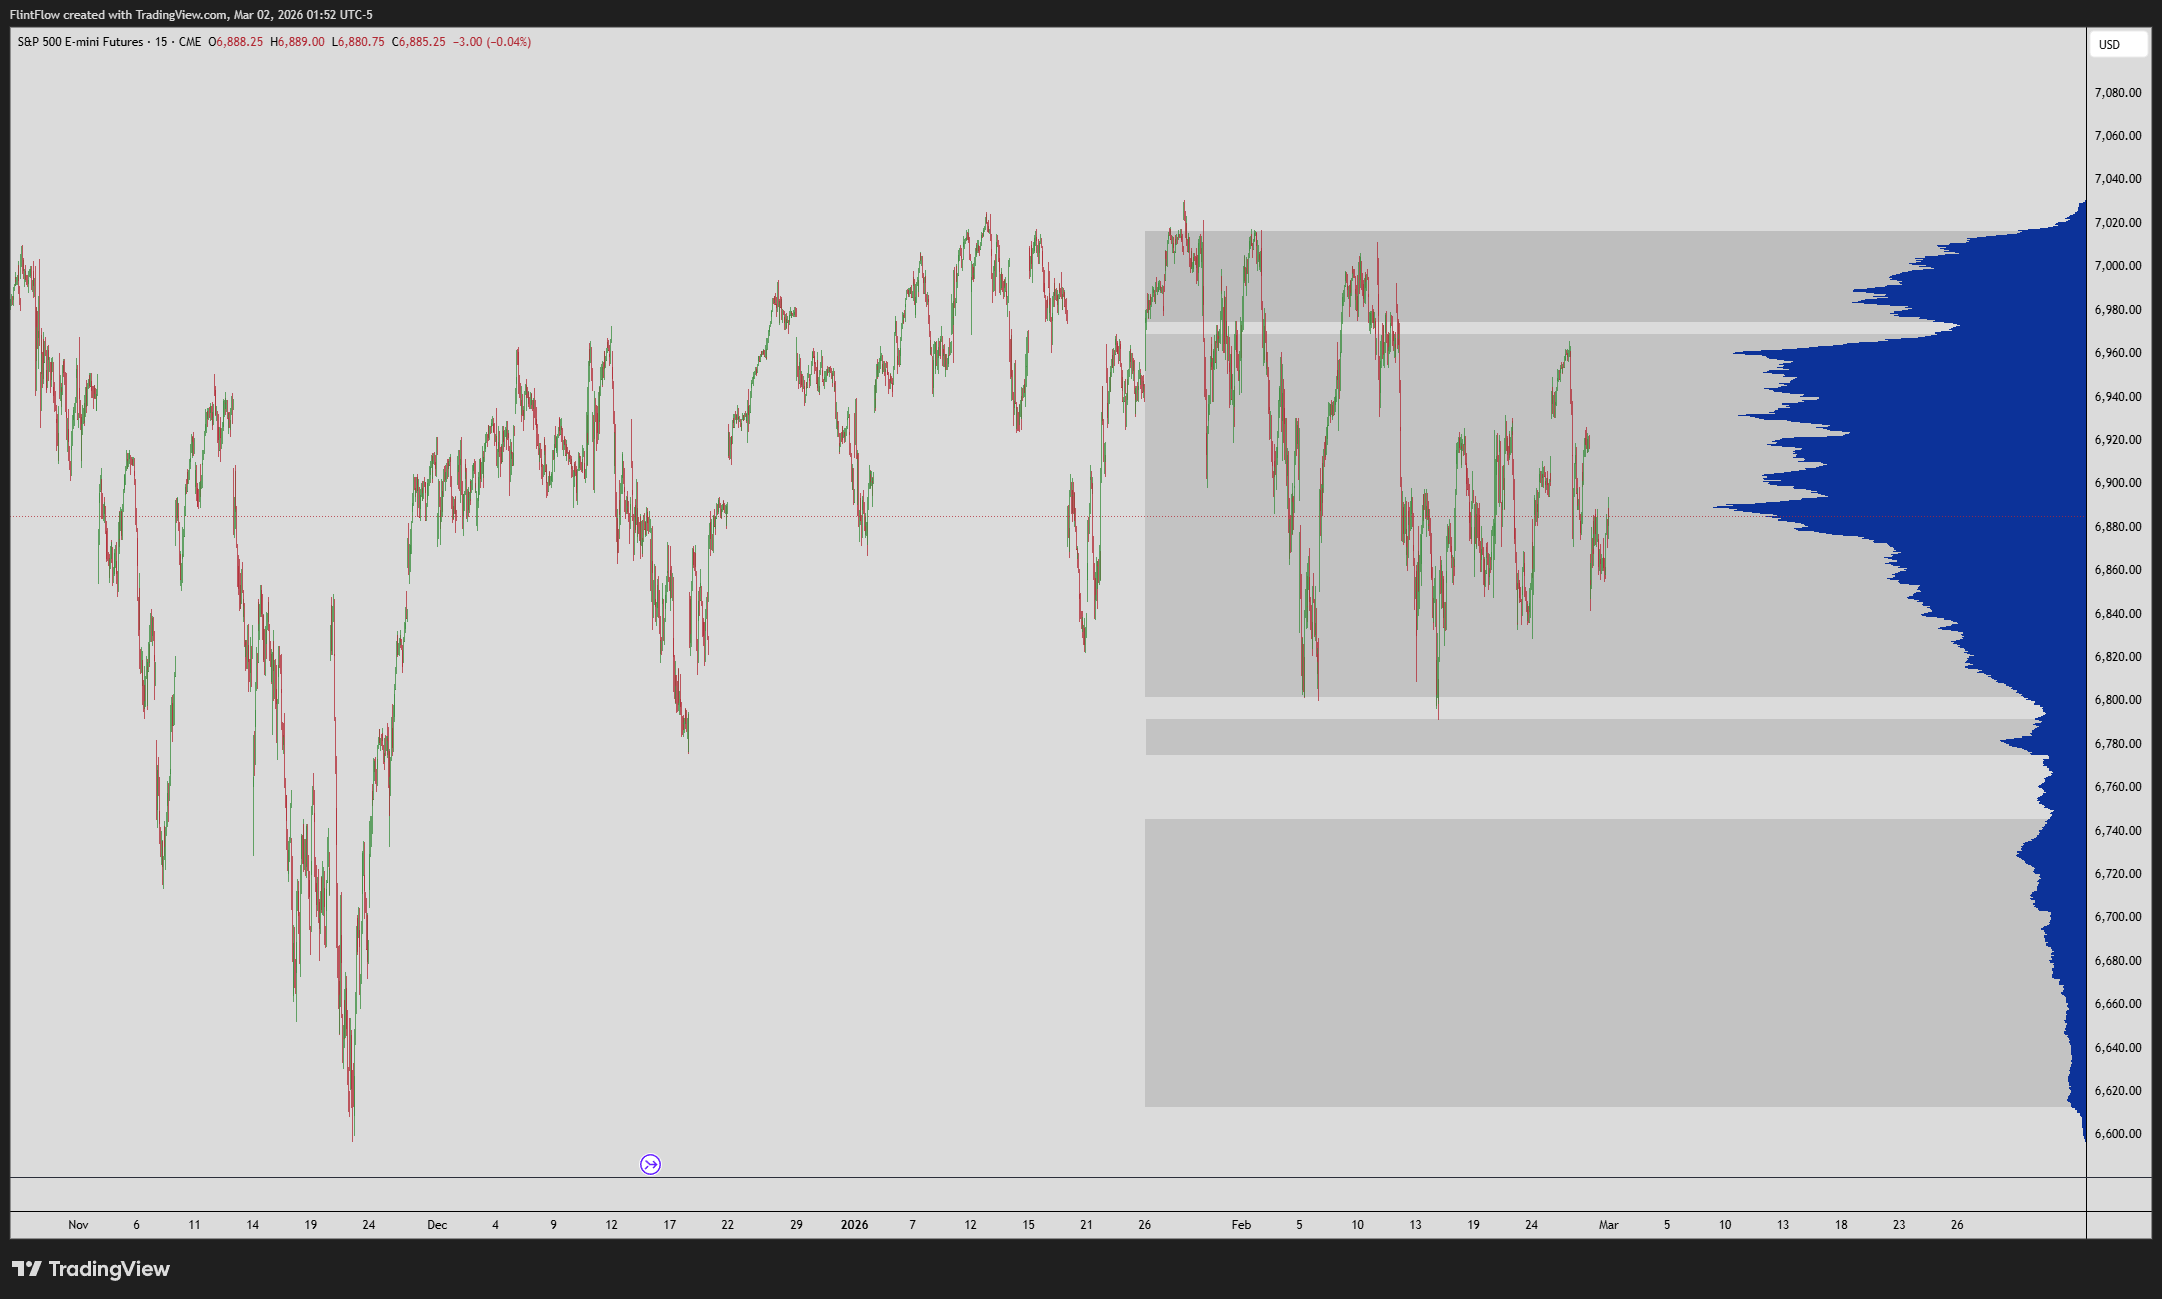
This makes the 6802 value area low a pivotal point for the remainder of the week.
Now that we have a prime catalyst for potential volatility, we can spread our targets out to other major levels. Let’s be blunt about the cases for bullish and bearish momentum. If price is able to remain above the value area low, we should expect a move back toward the 7000 psychological level. However, I believe we will once again see sellers step in to move price back down to that 6889 point of control.
For the downside, I strongly believe that further escalation between the US and Iran could send this market into the low 6600s. There are three levels to watch for downside: the high-volume node (HVN) at 6782, the point of control inside the lower value area at 6729, and the value area low at 6613. The most logical path for bears is to target that 6729 POC before seeing any type of relief. If the conflict continues to escalate, we could move right back down to that 6613 value area low. We must pay close attention to all incoming news revolving around the US-Iran conflict.
On a daily basis, we are leaning on the 6802 VAL as key support for moves back to the 6889 point of control. If the market bounces off 6802 and spikes to 6889, we want to see price hold that level as support for a break toward the VAH. For example, if we open Monday and spike to 6889, we will likely use that POC as support for continued upside in the next session.
You must approach the market with a risk-to-reward perspective. The most attractive level for longs is right around that value area low. If the market opens at 6870—just below the POC but well above the VAL—there really is no room for a position. I would rather focus on a potential sell-side move back to the VAL before attempting a long. For the downside, it is different; you want to play the break. Once we break below the 6802 VAL, you want to be short to capture the move toward 6729 and 6613.
Each session, I will deep dive into these levels and provide more context. This leads us into our daily scenarios.
Daily Scenarios
Scenario A: If price is able to remain above 6802, I expect a strong rally back up to the 6889 point of control.
Scenario B: For the downside, we want to give the 6802 level some room. We will use the key low-volume node at 6794 as the trigger to activate shorts. Once below this level, I expect a swift move down to the 6729 point of control.
That is all for me. I hope you all have a great week.
Disclaimer
General Risk Disclosure: Trading in the stock market involves substantial risk and is not suitable for every investor. The valuation of stocks may fluctuate, and as a result, clients may lose more than their original investment. The impact of seasonal and geopolitical events is already factored into market prices. The highly leveraged nature of stock trading means that small market movements will have a proportionally larger impact on your traded funds, and this can work against you as well as for you.
No Guarantee of Accuracy: The information provided in this newsletter is obtained from sources believed to be reliable and accurate; however, Flint Research does not guarantee its accuracy or completeness. The views, opinions, and analyses expressed herein are provided as general market commentary and do not constitute investment advice.
No Investment Recommendations or Professional Advice: Flint Research is not a registered investment advisor or broker-dealer. The content provided in this newsletter is for informational purposes only and should not be construed as investment advice. It does not constitute an offer or solicitation to buy or sell any securities or to adopt any investment strategy. Any decisions made based upon the information provided in this newsletter are the sole responsibility of the reader. We recommend that you seek advice from a qualified professional advisor before making any investment decisions.
Past Performance Not Indicative of Future Results: Past performance of a security or market is not necessarily indicative of future trends. Historical data should not be relied upon as a prediction of future market movements.
Regulatory Compliance: Flint Research complies with all applicable laws and regulations, including those set forth by the U.S. Securities and Exchange Commission (SEC). We are committed to maintaining the highest standards of integrity and professionalism in our relationship with you, our client.
Conflicts of Interest: Flint Research and its staff may hold positions in the securities mentioned in this newsletter. These positions can change at any time.
Use of the Newsletter: The information provided in this newsletter is intended solely for the personal, non-commercial use of its subscribers. Redistribution of this newsletter in any form is prohibited without the express written consent of Flint Research.