


Welcome back, everyone.
First, I want to cover some details on the recent developments in the AI mania. Warning signs appeared a while ago when companies started pushing absurd spending followed by highly ambitious goals.
What the Surge in AI Spending Has Taught Us
The recent wave of earnings reports has highlighted a glaring issue: the massive capital expenditures poured into AI are not yet matching the promised returns. Big Tech is spending at a historic rate, with AI-related CapEx estimated to have breached 7 percent of US GDP. To put that into perspective, this surpasses the peak tech spending seen during the height of the dot-com bubble.
While artificial intelligence is undeniably a generational technological shift, history is filled with examples of infrastructure booms that devastated early investors because the spending ran too far ahead of actual commercial monetization.

The Telecom Fiber Overbuild (Late 1990s): During the dot-com era, telecommunications companies spent aggressively to lay millions of miles of fiber-optic cables, banking on an immediate, insatiable demand for internet bandwidth. The demand eventually arrived, but not before severe overcapacity and massive debt loads led to historic bankruptcies, such as WorldCom and Global Crossing. The infrastructure changed the world, but the original investors absorbed massive losses.
Circular Financing Deals: Today, we are seeing complex arrangements where mega-cap tech companies invest billions into private AI startups, which then turn around and use that exact capital to buy chips or rent cloud computing power from those same mega-caps. This closely mirrors the vendor financing practices of late-90s telecom equipment companies like Lucent Technologies, which artificially inflated short-term revenues while masking true, organic demand.
The Railroad Booms (1800s): We can look even further back to the railroad buildouts. Laying the tracks revolutionized global logistics and the broader economy, but the immense, upfront capital required led to severe overinvestment, brutal price wars, and eventual economic panics. The societal benefit was massive, but the initial builders often went bankrupt.
The core lesson for traders and investors is to separate the technological promise from the immediate investment reality. As current earnings calls are proving, Wall Street’s patience is wearing thin. Companies are being punished for building the infrastructure without a clear, near-term path to profitability, triggering the exact unwinding we are seeing in the markets today. The clear winners are the semiconductor producers, while the companies purchasing them will be the ones taking the hit.
We can relate this to the next big thing that may come. All manias will end up looking quite similar, and we can use historical ones as a reference. To be clear, this is not to say you will perfectly time the top, but you can closely monitor the unraveling of one. The script could flip back in favor of AI if companies start producing strong revenues from their investments. However, even if a company posts strong revenues, it could still fall below the sky-high expectations set when the mania started, causing the stock to sell off anyway.
For instance, if a company making $5 billion in revenue per quarter gets on an earnings call and promises revenues will triple within the next year, a subsequent quarter of $6 billion might be historically strong. But because the stock moved exponentially higher based on the previous promise, that $6 billion will be seen as a disappointment. Look at Oracle: they made massive promises of future revenues, yet the stock got absolutely crushed. They didn’t see terrible revenues, but it shows how aggressive the selling can be when expectations aren’t met.
When looking at earnings, you need a great idea of what the company previously promised and whether those promises are being met. You may see a double beat that seems solid, but under the hood, they could be way off their projections. Stock prices are based entirely on the future performance of a company. There are many similarities we can draw from the historical manias of the past.
Let’s move on to stocks that are setting up for some strong moves.
Stocks
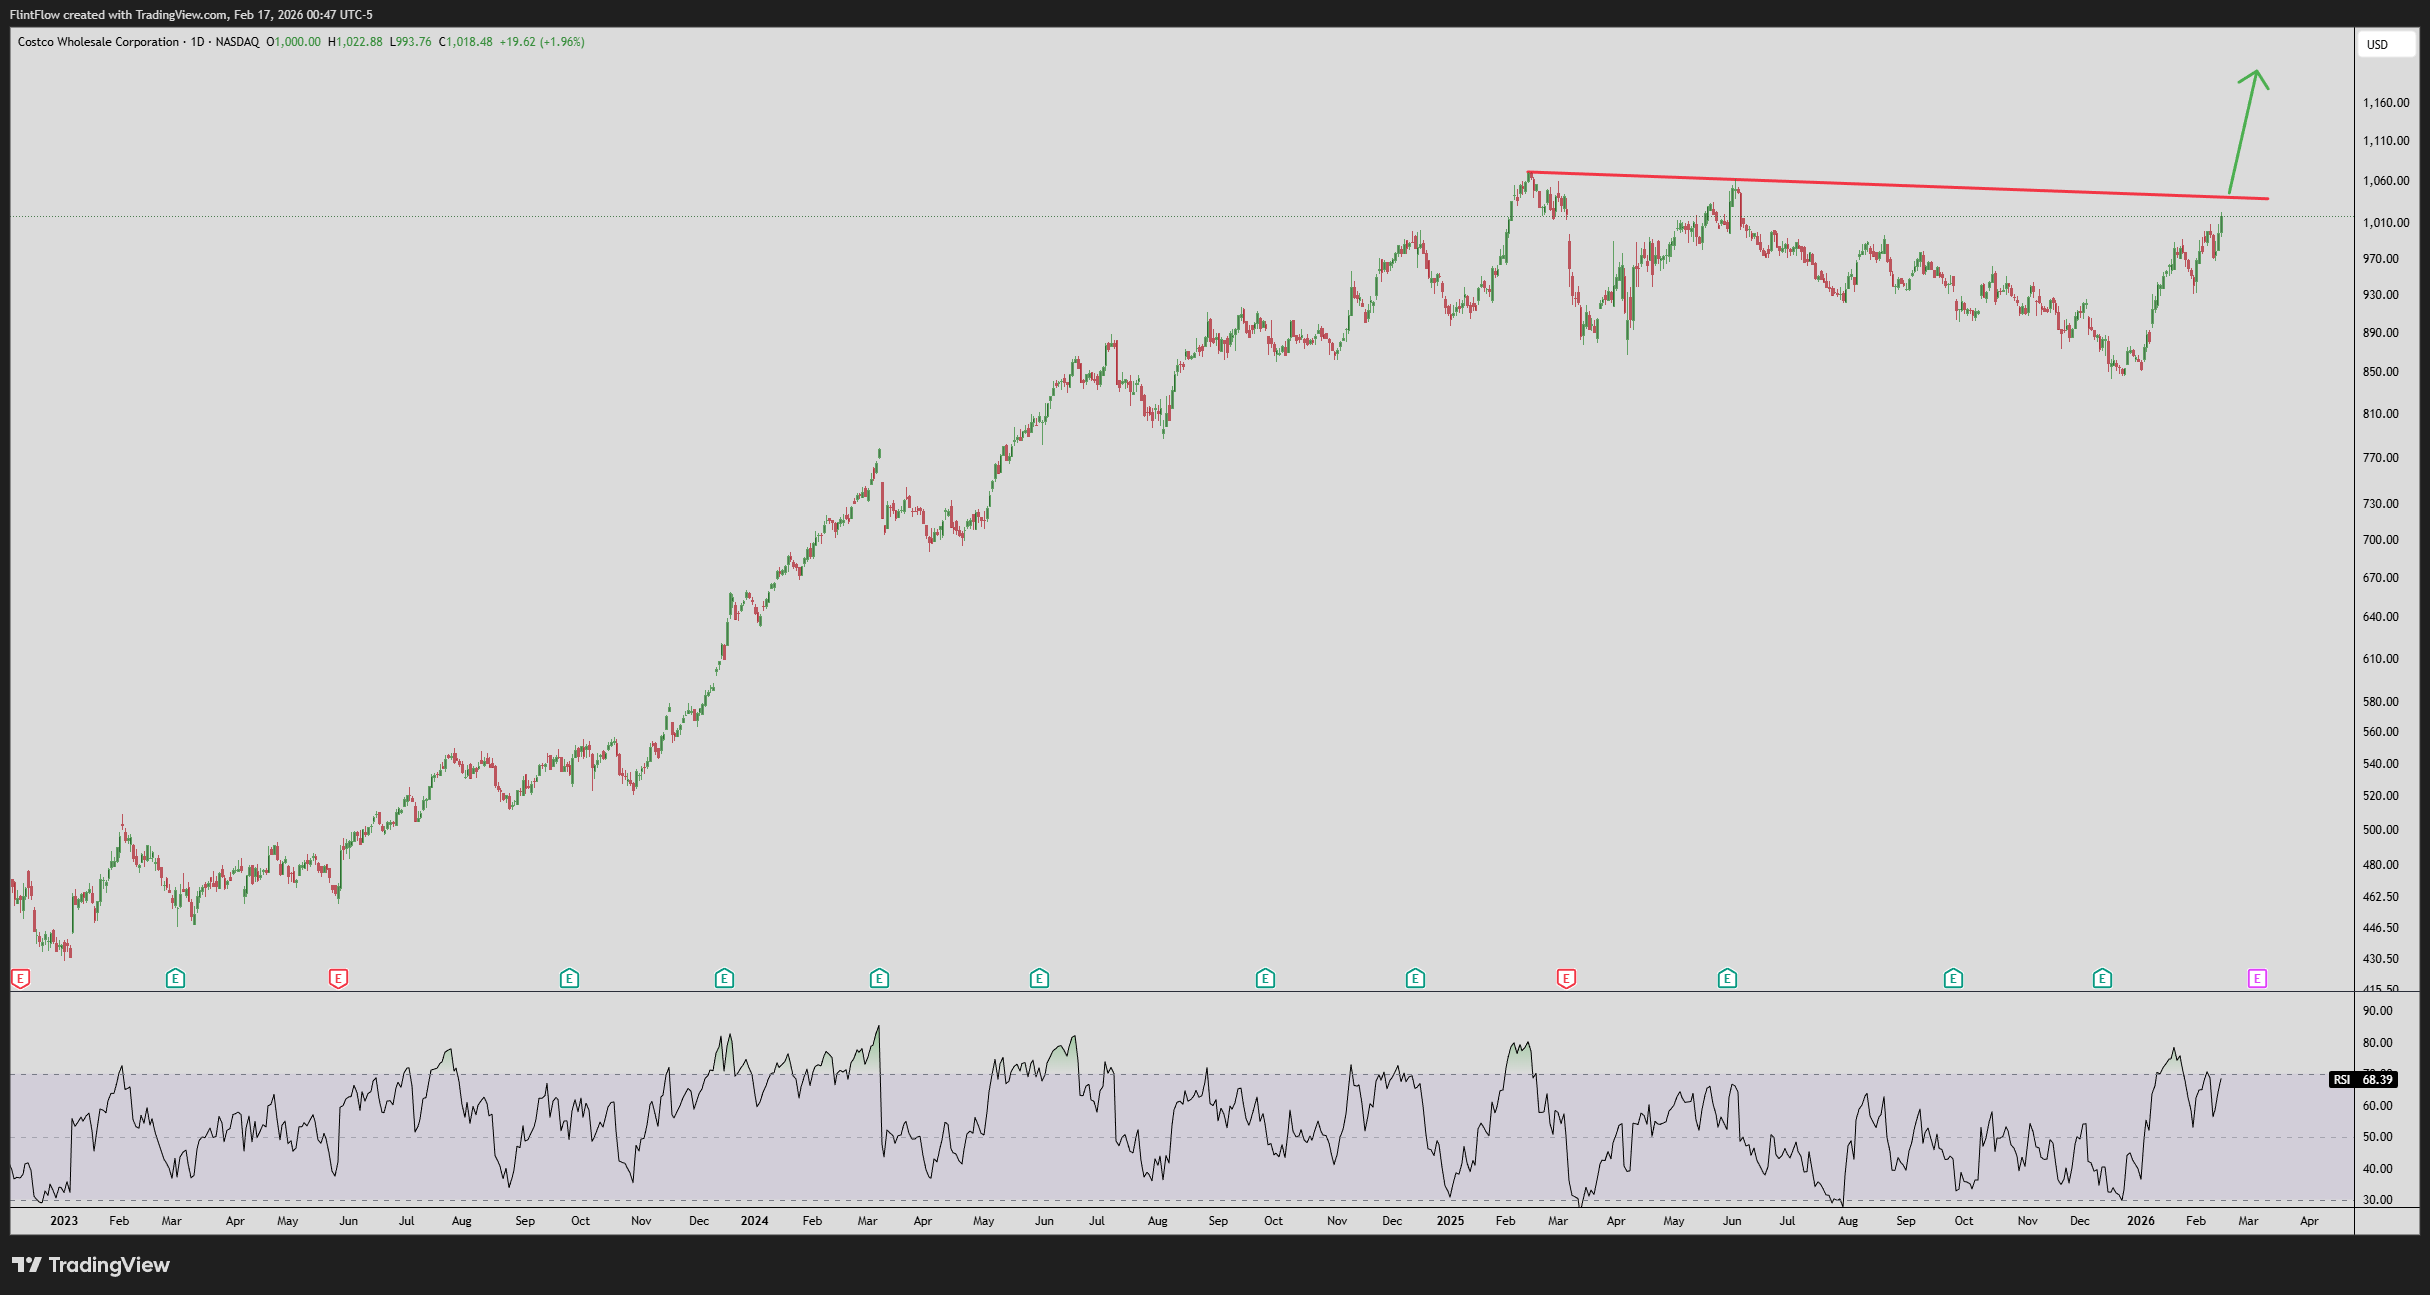
Costco (COST) is setting up for a break through all-time highs. If we can get a close over 1040, this will confirm a breakout for a strong move higher. This seems to be next up, just like the move we called on Walmart. It could see a straight-line move higher up to 1200. Even with market downside, this could be used as a hedge against the overall indices. Over the last few weeks, we have seen indices moving up and down while this stock has rebounded sharply back to highs. It is looking good for the break higher, with confirmation being a weekly close over 1040. An update will come once this long setup is validated.
This is the only new setup I really have my eyes on going into this week. We have plenty of long setups already working, along with some shorts as well.
Let’s dive into how the indexes finished last week before moving on to the Economic Calendar and S&P levels for today’s session.
Index Trends
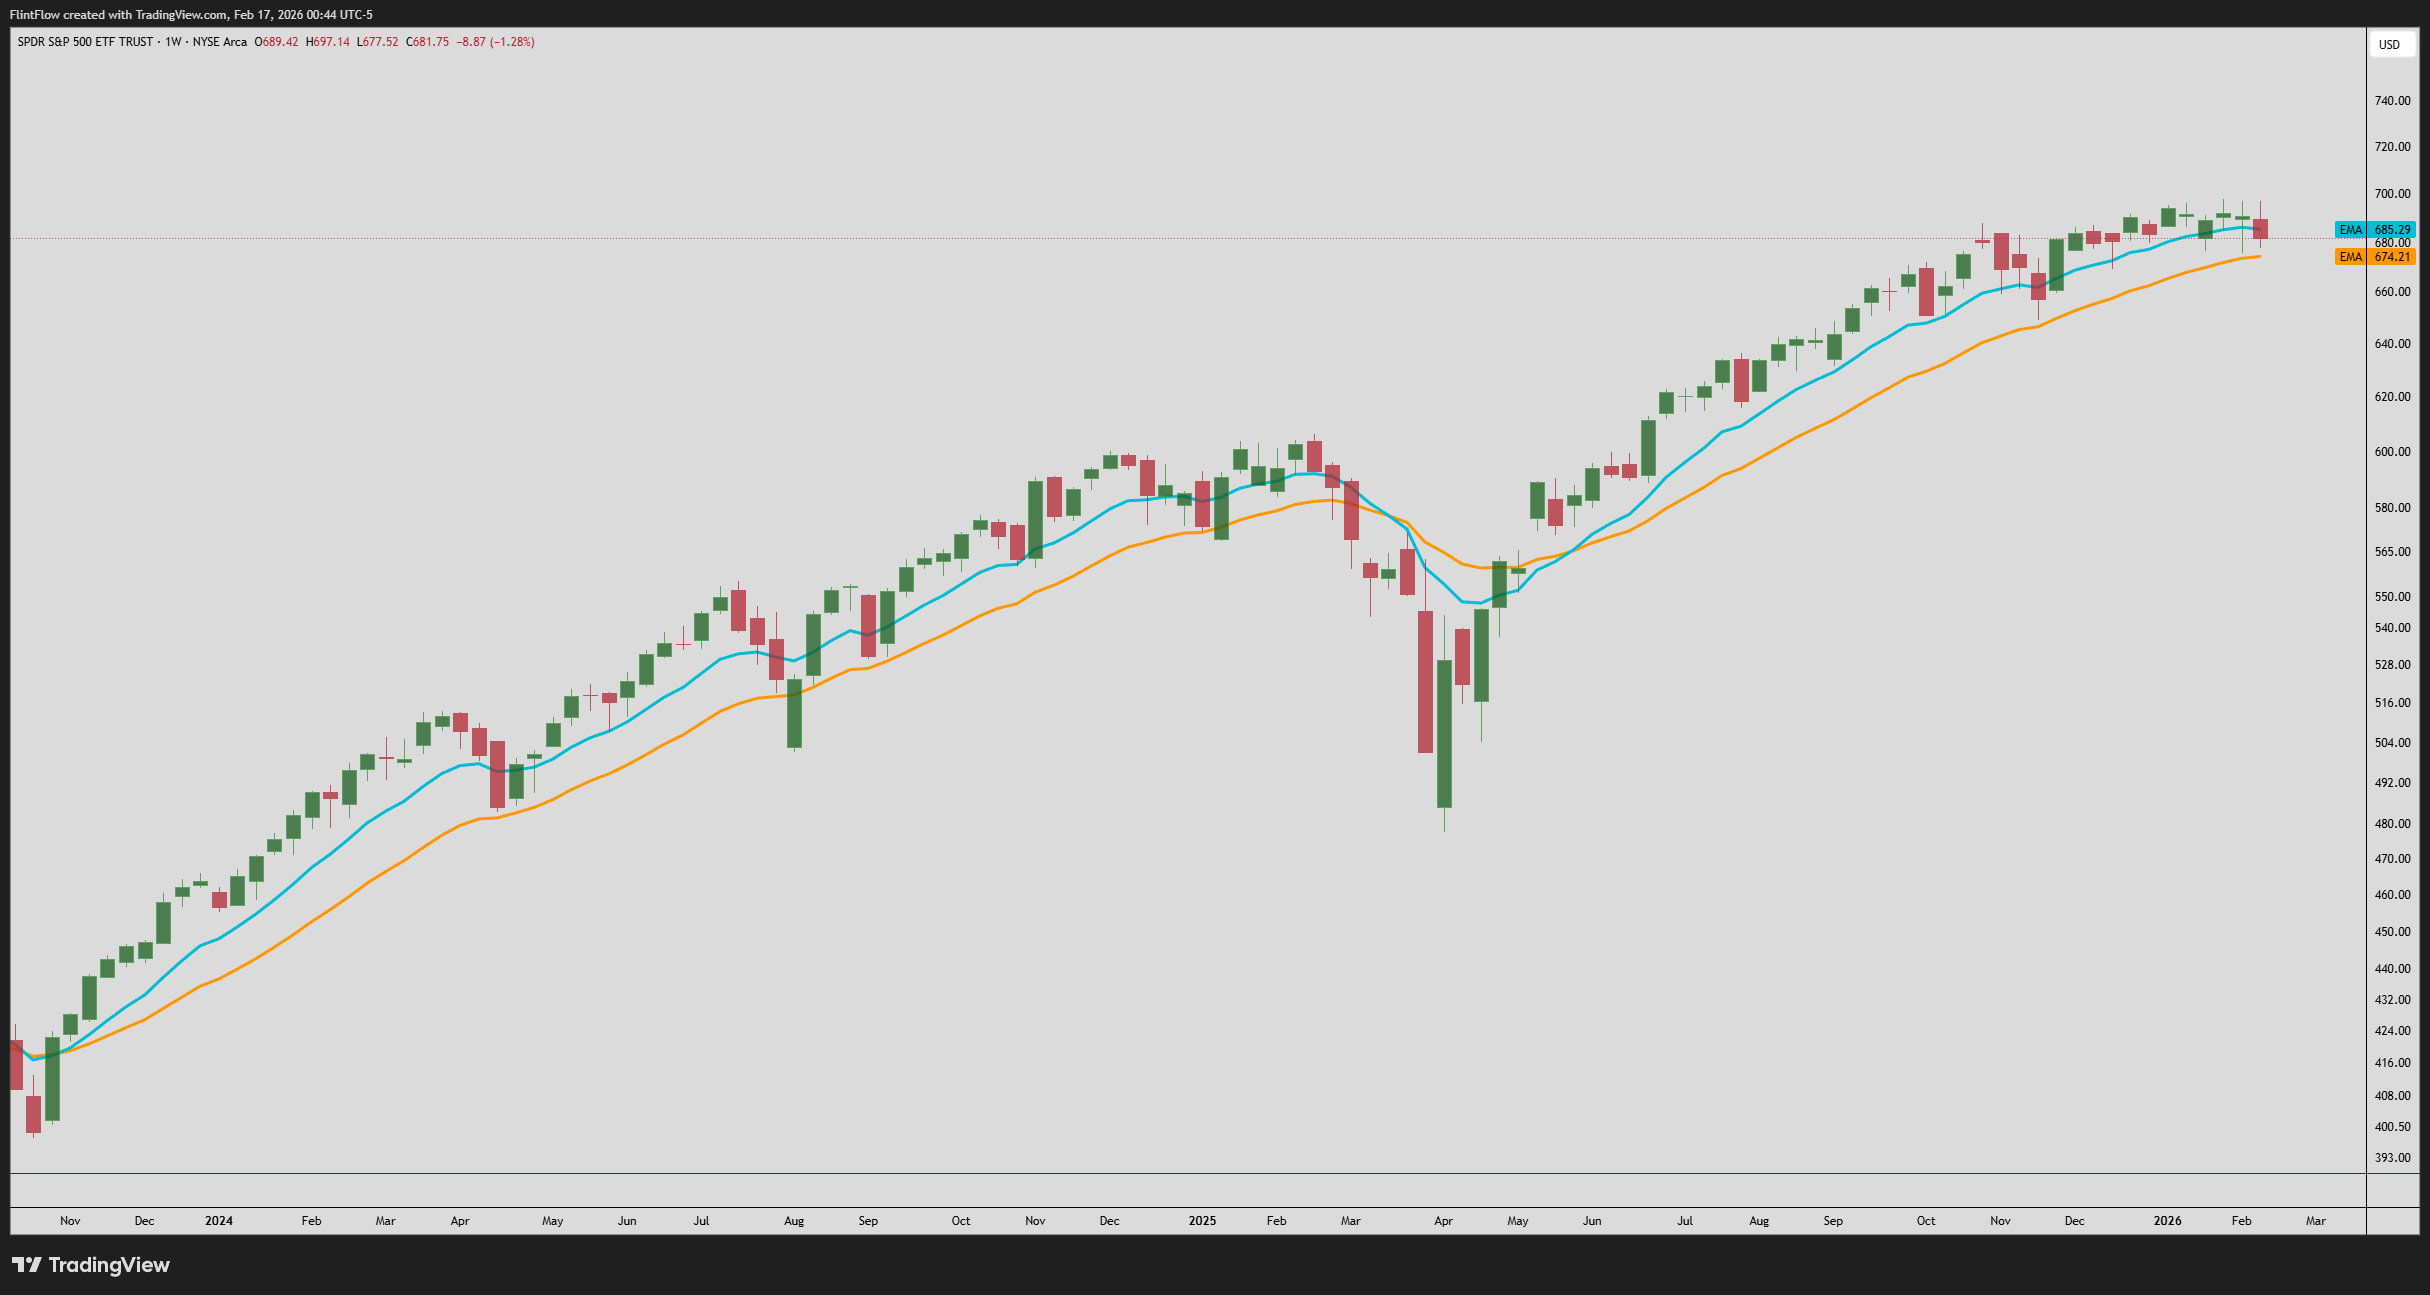
(SPY) We saw the first weekly close below the 10-week EMA in 12 weeks. The last time this happened, price bounced off the 21-week EMA. Over the last week, we saw price come close to the 21-week before seeing some relief. In the near term, we can expect further selling down to the 21-week EMA, which is now a must-hold for bulls. The 21 tends to be a key support level when we are in a medium-to-long-term uptrend. Watch closely where we close this weekly candle—whether it is above the 10 or below the 21. Anytime we see breaks below the 10, expect downside to the 21; below the 21, we can start to see strong selling step in. Two recent examples of this are March 2025 and August 2024. In August, we saw a swift 3% gap down heading into the week, and in March, we dropped 16% in the following five weeks.
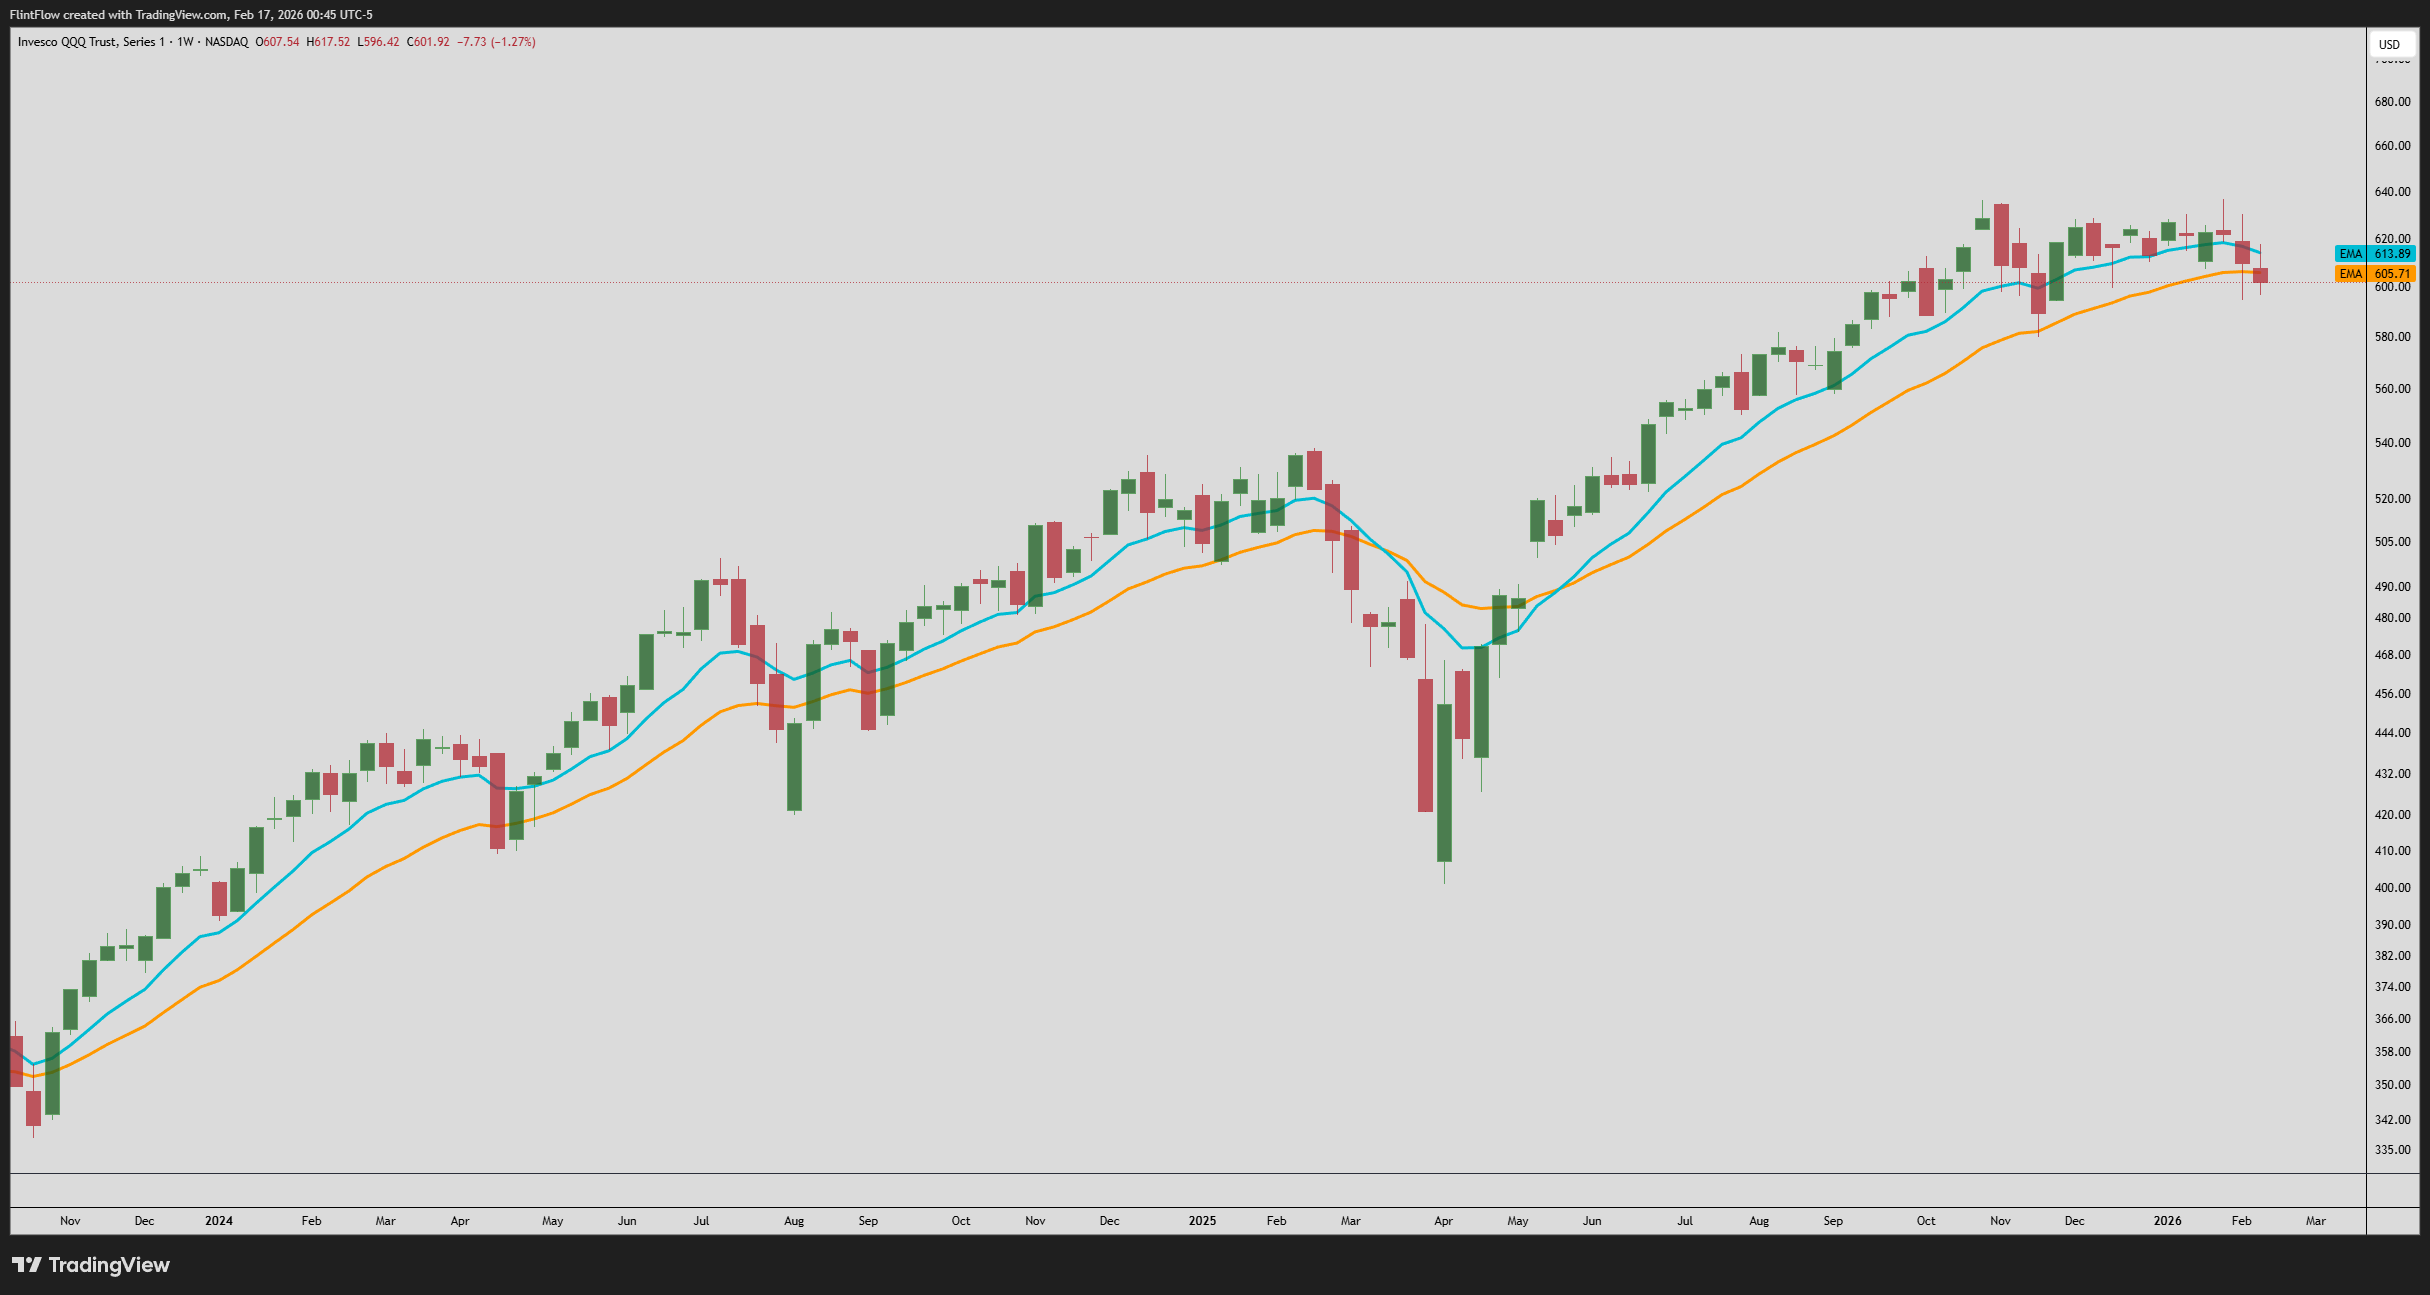
(QQQ)The Nasdaq shows quite a different story, as price has seen a weekly close below the 21-week EMA. What we need to pay close attention to is if the SPY follows through and also breaks below the 21. Back in September 2021, we had the exact same scenario. Price on the QQQ closed the week below the 21, while the SPY held above. The following week, we saw a sharp bounce on both indexes that reclaimed the 10-week EMA. Given the overall weakness in tech, we really need to see the SPY follow with further downside to confirm a broader market slide. Ideally, we bounce back and stocks continue to push higher, but we must watch closely to see if this market is ready to slide lower.
Economic Calendar
Tuesday: None.
Wednesday: Building Permits/Starts & FOMC Minutes
Building data will be important for our building stocks: AGX, BLD, and IBP. We want to see an increase in building starts along with permits. Growth in this data, especially with these stocks near all-time highs, can really spark a leg higher this week. The FOMC Minutes show the majority supporting holding interest rates, with two members voting for a 25 bps cut. Powell reassured everyone at the last press conference that we have started the year strong in terms of economic data.
Thursday: None.
Friday: Core PCE and GDP
Both of these releases will be important in guiding the Fed forward regarding interest rate cuts. For the last nine months, Core PCE has remained consistent, moving higher only around the 0.20% range, which is the average for the last two years. Another stable release here will support markets and potentially prevent further downside to finish the week. GDP, on the other hand, is moving higher at a rapid rate, with the latest release at 4.4%. Excluding the COVID anomaly, we have not seen GDP push this far above 4% in the last ten years. If we can get a lower Core PCE and a higher GDP, we have a recipe for a strong index rally. This will set the tone for the following week of trading.
