


Welcome back, everyone. I hope you all had a great weekend.
Once again, we look to be heading into another volatile week. The S&P and Nasdaq have been in an interesting spot for the last couple of months. We have seen many failed attempts to break to new highs, resulting in sharp sell-offs back down to the 21-week EMA.
The two indices continue to show a divergence on the weekly timeframe. The S&P has closed above the 10-week EMA for 11 weeks straight, while the Nasdaq closed below the 10-week EMA for the first time in 10 weeks. The reason is quite obvious: tech has taken a beating in the last week, while the RSP (the equal-weighted S&P 500) has continued to break to new all-time highs.
A few weeks back, I warned that the Nasdaq was showing signs of tech weakness, though for the most part, we avoided the worst of the selling. Our main tech stock is Apple, which is heading right back up to all-time highs. This week will be very important, with the main focus being where the Nasdaq closes. If we get another close below the 10-week EMA, I expect we will soon see an attempt to break below the 21-week EMA. A larger sell-off will likely develop and broaden to the rest of the market. To be clear, inside the Flow State series, we primarily look at the higher timeframe perspective so we can prepare for the week ahead.
Here’s a checklist everyone should be using:
Uptrend
Uptrend: 10-Week EMA above 21-Week EMA with price having a weekly close above the 10-Week EMA.
First Signal of Trend Possibly Breaking: Price closes below the 10-Week EMA on a weekly timeframe.
Confirmation Trend is Broken: Price closes below the 21-Week EMA on a weekly timeframe.
Downtrend
Downtrend: 10-Week EMA below 21-Week EMA with price having a weekly close below the 10-Week EMA.
First Signal of Trend Possibly Breaking: Price closes below the 10-Week EMA on a weekly timeframe.
Confirmation Trend is Broken: Price closes below the 21-Week EMA on a weekly timeframe.
Let’s now dive into the charts of both the SPY and the QQQ.
SPY
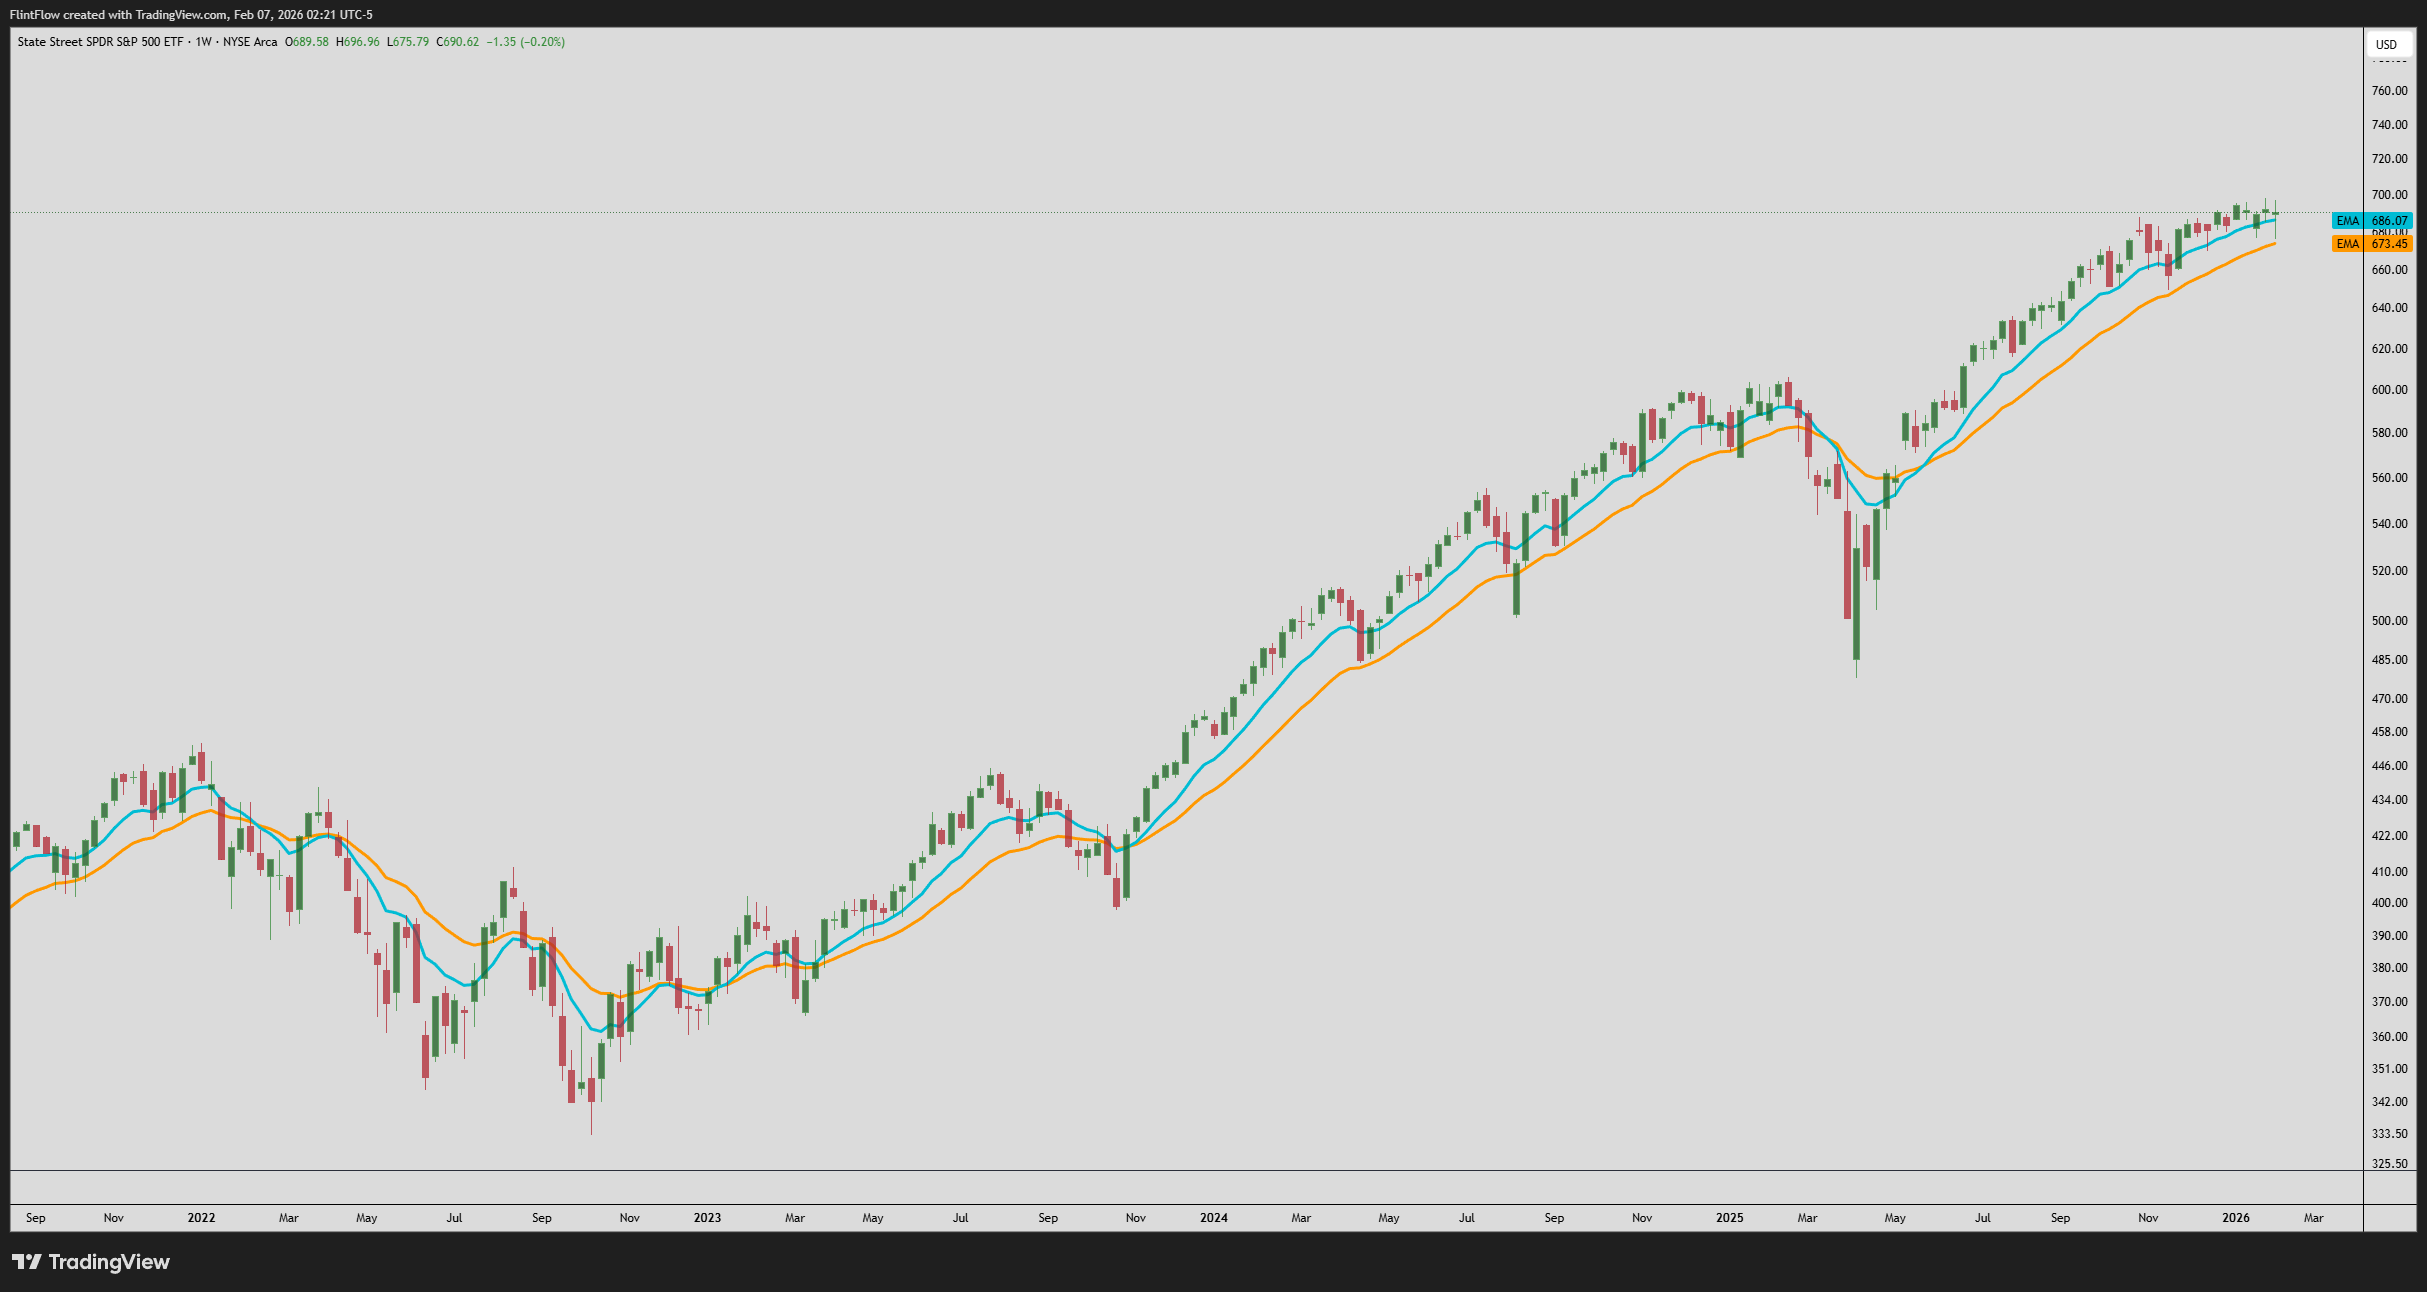
After last week, we can see that once we sold off below the 10-week EMA, we got a swift move right down to the 21-week EMA. Friday’s bounce brought a sharp recovery to reclaim back above the 10-week. As we noted in the previous post, any sell below the 10-week will target the 21-week. The sell-off reached our target, which was exactly where the market rebounded. This looks quite bullish when looking at this chart alone, but the QQQ tells a different story.
QQQ
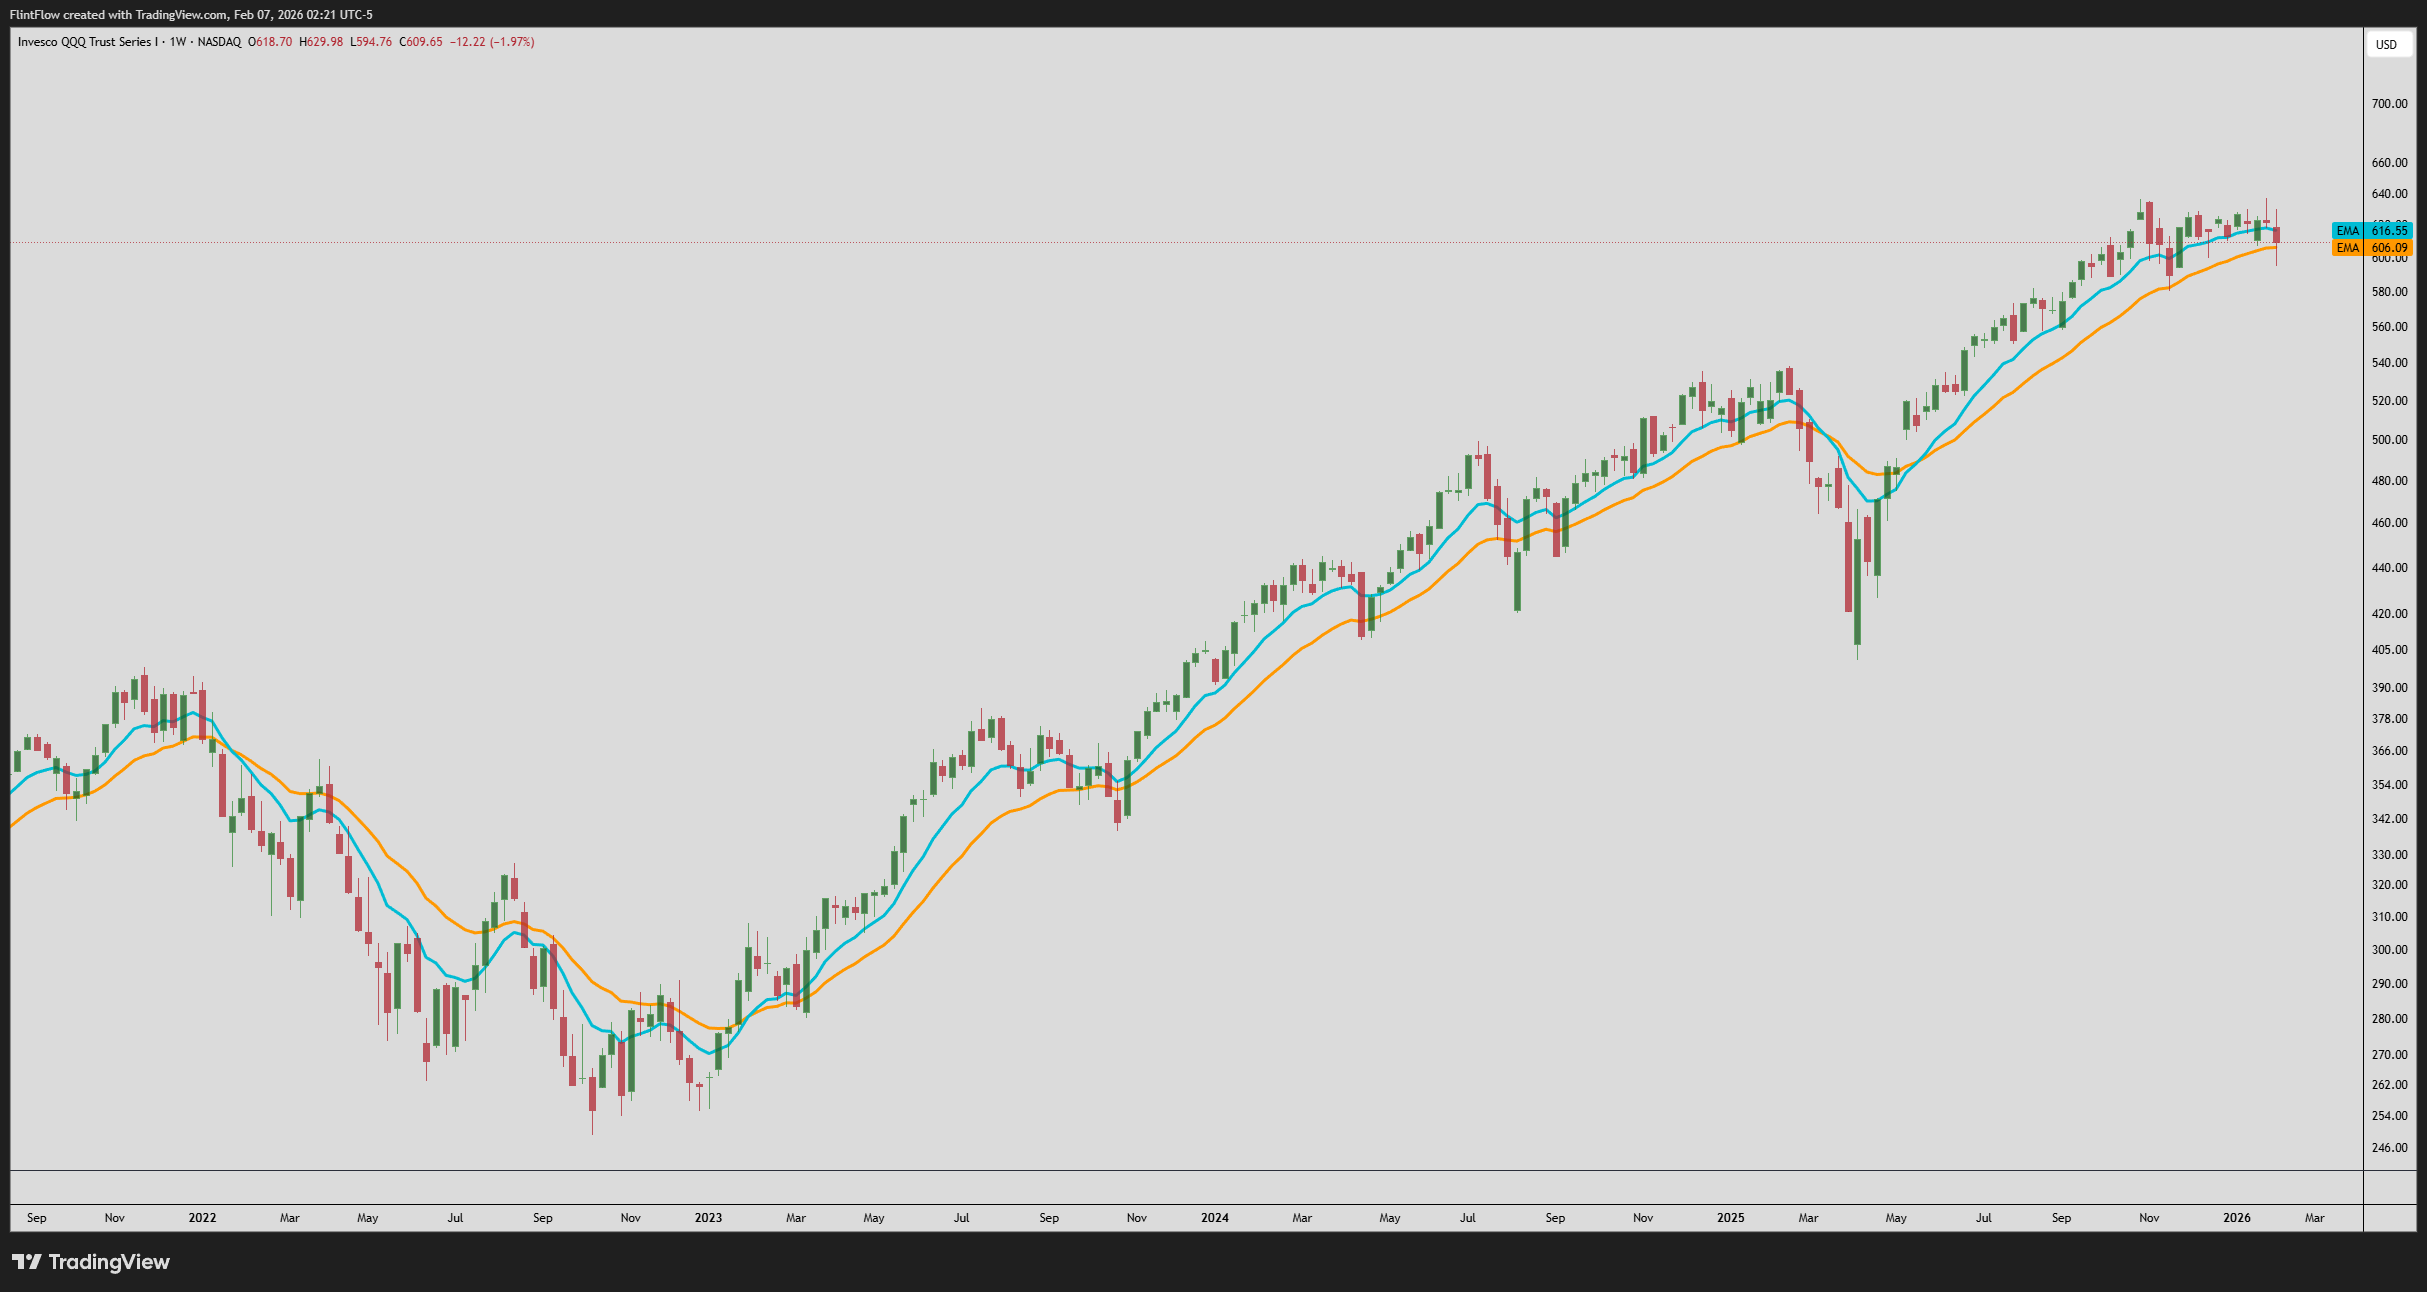
The main problem with the Nasdaq is that we have put in a double top and closed below the 10-week EMA. I don’t put as much weight into the double top as I do the moving averages, but it is notable. We also broke the weekly structure of higher lows. Almost everything on this chart is signaling that further selling is coming. As long as we remain below the 10-week EMA, I expect new lows to be hit below the 580s.
The current structure of the overall market is really the same as the previous week: rallies are likely to be sold into for a move back to the lows. If you are going to focus on shorting, tech would be the best option. Remember, tech is the main sector getting hit the hardest.
Going into each week, we use a simple process to show the current trend, and then we dive into deep analysis using Volume Profile. That is where the true value is found, as we can pinpoint where buyers and sellers are most active. Before moving onto that, we need to go over the economic calendar for the week.
Economic Calendar
Monday: None
Tuesday: None
Wednesday: Unemployment Rate
Thursday: None
Friday: CPI (Inflation)
We will now move into the Volume Profile analysis on the S&P.
S&P Levels
We once again finished the previous week inside the large value area ranging from 6808 to 6968. Price reclaimed back above the 6932 point of control (POC), which was the key pivot we used. For this week, I want to lean on the low-volume node (LVN) between the current value area and the one above.
