Good morning, readers!
Emini experienced an intriguing setup during the cash session, presenting two short opportunities that emerged after the CPI data release and later within the same cash session. An update was promptly sent on X, which turned out to be a perfectly timed warning, highlighting the initial area of interest where buyers might potentially step in.
These significant levels were shared for both Emini and Nasdaq, denoted as 4490 and 15240 respectively. Astonishingly, the market came extremely close to touching both levels before establishing the groundwork for the subsequent long trades. Following the breach of these long levels, Emini embarked on an impressive rally, gaining a remarkable 30 handles, while Nasdaq surged by nearly 100 handles.
Nonetheless, this rally's duration was limited as it was followed by a swift downturn, marked by a collapse through the short levels. Emini, in particular, witnessed a decline that brought it down to the anticipated short target, resulting in a 40 handle sell. Correspondingly, Nasdaq demonstrated a significant drop of 150 handles, aligning with the projected sell-off.
In the equities realm, Chipotle, which we identified as a bearish candidate when it reached 2100, reached a new low today, 1846. The bearish momentum extended to Roblox, which plummeted to its 28 target, following our bearish stance declared at 38. Alibaba, initially mentioned at 96, made an impressive leap to 102 today. Moreover, Duke Energy, introduced at 88, managed to clear the 94 level, displaying notable strength.
Sector Performance (Previous Session)
The Technology (XLK) and Communications (XLC) sectors both witnessed declines of approximately -0.73% and -0.57% respectively. These setbacks could be attributed to profit-taking strategies and concerns surrounding potential regulatory changes. Despite these short-term hiccups, these sectors remain pivotal in our digital-centric world. Their enduring potential to drive innovation and shape market dynamics over the long term is evident.
In the Consumer Discretionary (XLY) sector, a decline of -0.56% was observed. This downward trend might reflect shifting consumer spending patterns or evolving behaviors. Given the sector's diverse range of industries, including retail and entertainment, such performance changes can provide valuable insights into consumer sentiment and broader economic conditions.
Both the Industrial (XLI) and Health Care (XLV) sectors experienced marginal declines of around -0.58% and -0.35% respectively. These sectors are influenced by an array of factors, such as manufacturing trends, supply chain dynamics, and regulatory shifts. The slight downturns in these sectors might suggest a degree of stability in their underlying fundamentals.
In the Materials (XLB) and Financials (XLF) sectors, moderate declines of approximately -0.41% and -0.47% were recorded. These dips could be indicative of challenges related to supply chain disruptions, fluctuations in commodity prices, and regulatory complexities. Given their integral roles in the economy, the performance of these sectors could serve as signals for broader economic hurdles.
On a more positive note, the Real Estate (XLRE), Consumer Staples (XLP), Utilities (XLU), and Energy (XLE) sectors all displayed gains ranging from 0.21% to 0.67%. These upward movements could signify a preference among investors for stability, income generation, and adaptability in the ever-evolving energy landscape.
Markets Close Lower in Line with Expectations - What’s Next?
The CPI thesis has proven to be exceptionally effective, and I intend to apply the same thesis to the PPI. The methodology revolves around utilizing the volume profile to provide us with valuable insights, aiding in our decision-making process regarding trade execution. By keenly observing the market's directional movement, we can identify optimal points for both short and long positions.
In the case of Emini, it is crucial for it to sustain a position below 4492. Should this condition persist, it sets the stage for a potential downward journey towards the 4450 mark. Conversely, a decisive breach beyond the 4504 level would empower the bulls, allowing them to reclaim dominance and potentially catalyze a rally, propelling the price upwards towards the 4530 level.
As for the Nasdaq, its trajectory hinges on remaining under the 15256 threshold. Adhering to this guideline could potentially lead to a downward excursion, targeting the 15040 range. Conversely, should the price overcome the 15315 barrier, it could usher in a bullish resurgence, placing the control firmly back in the hands of the bulls and potentially triggering an upward momentum, aiming for the 15440 level.
Earnings
No earnings.
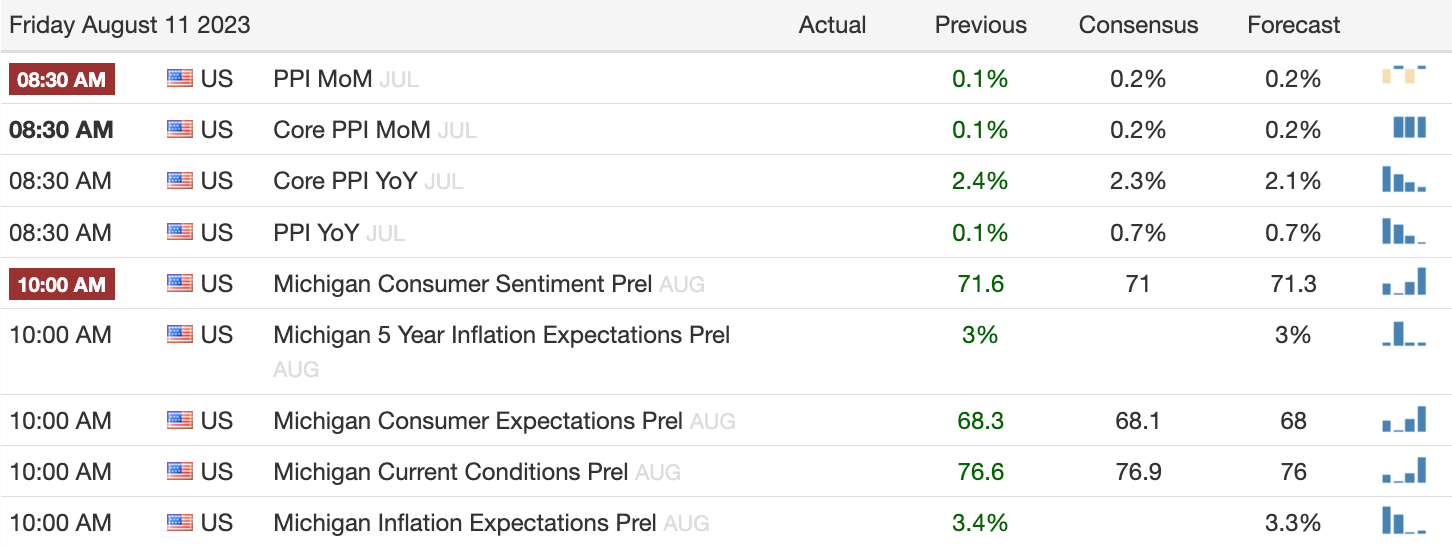
Events
Session Outlook
ES
Trend: Up
Trend Pivot: 4450
Value Area: 4375-4495, 4527-4615
NQ
Trend: Up
Trend Pivot: 14938
Value Area: 14276-14640, 14980-15422, 15547-16030
CL
Trend: Up
Trend Pivot: 73.12
Value Area: 67.61-73.82, 75.08-77, 78.62-80.54, 81-82.20
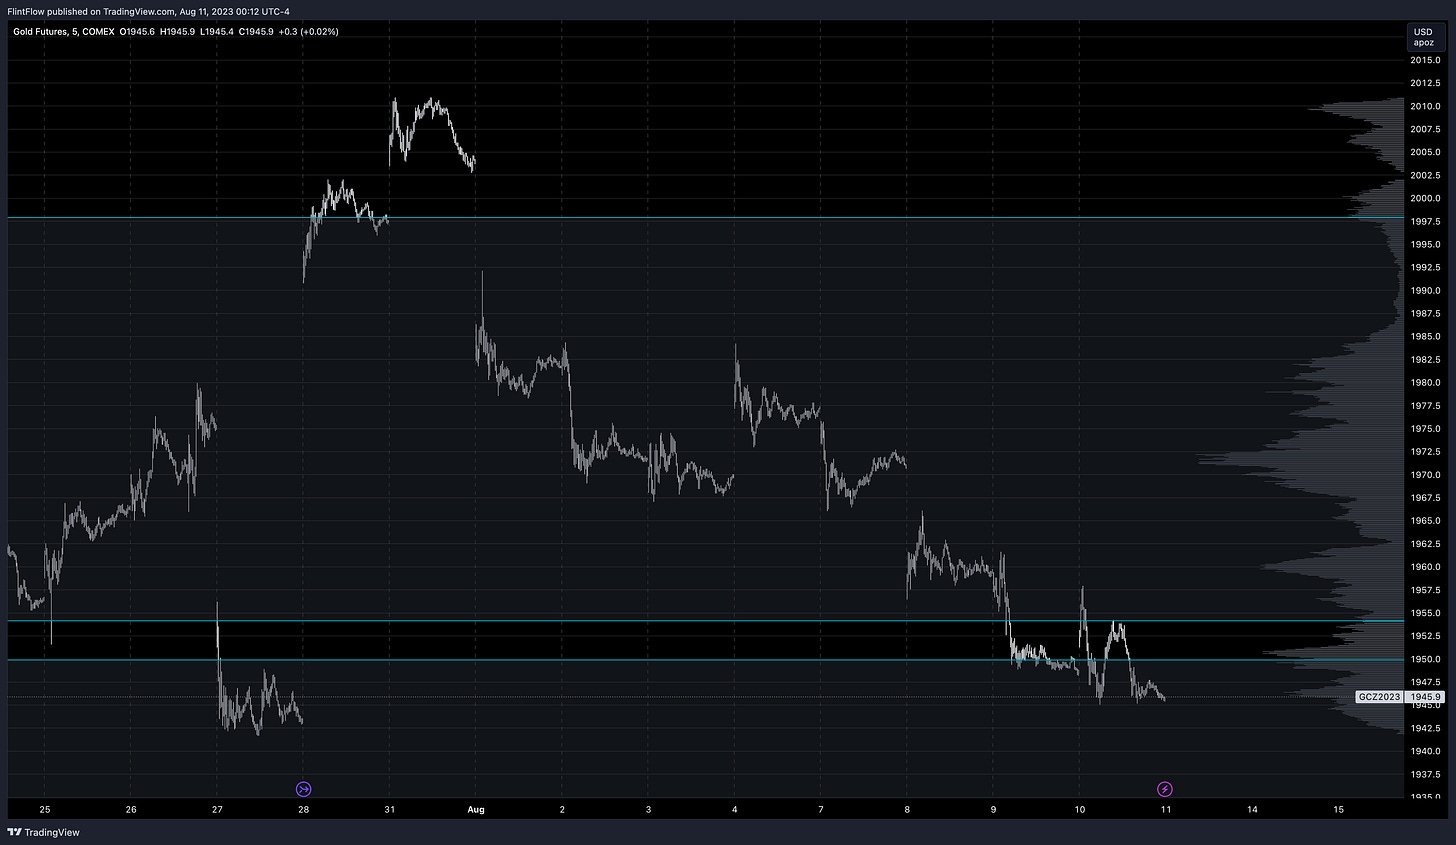
GC
Trend: Up
Trend Pivot: 1912
Value Area: 1912.1-1949.9, 1954.1-1997.9
NG
Trend: Up (B/O above 2.90)
Trend Pivot: Up = 2.90 / Down = 2.29
Value Area: 2.16-2.40, 2.51-2.78
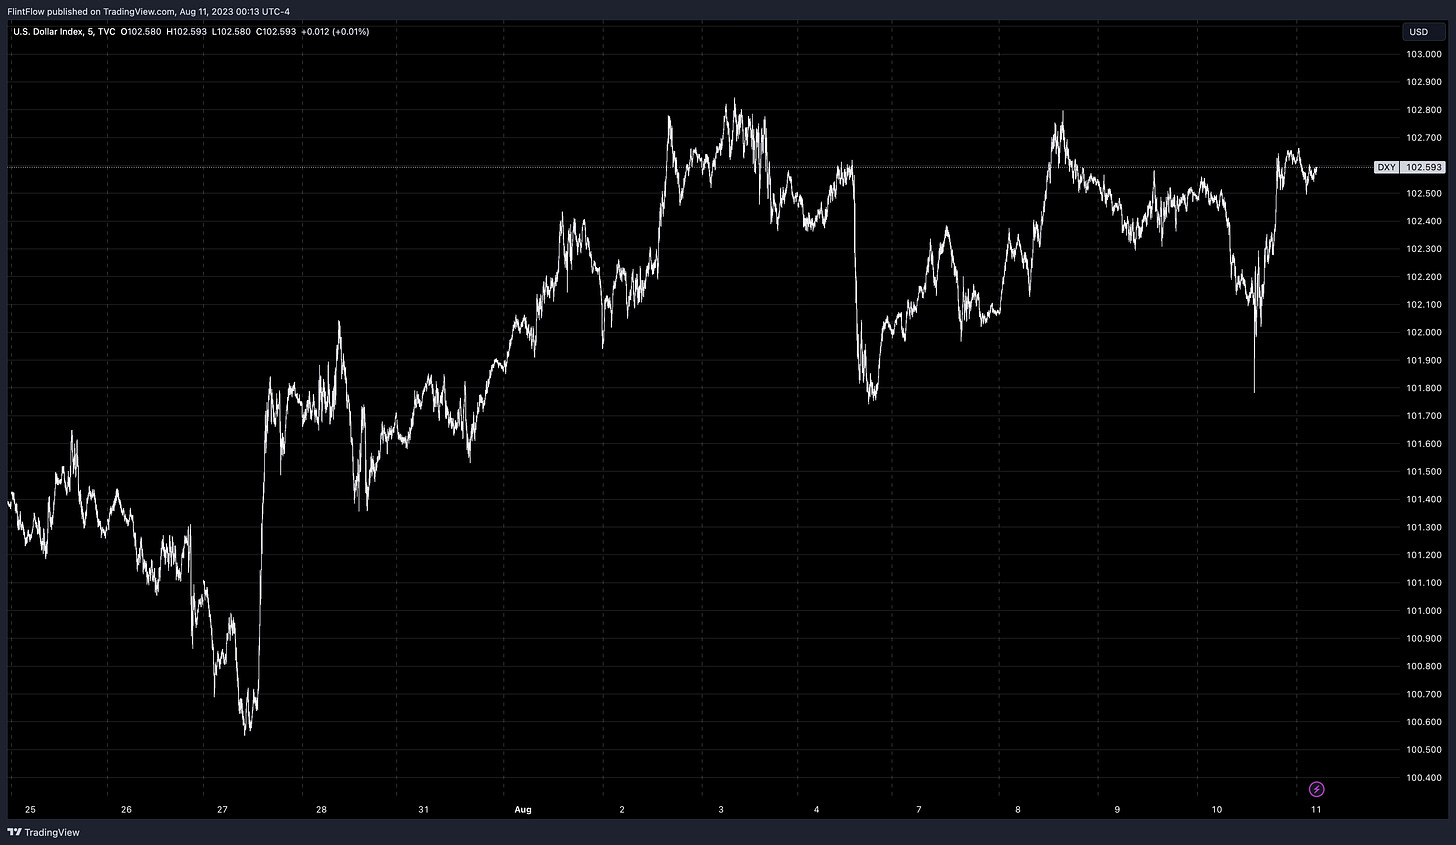
DXY
Trend: Down
Trend Pivot: 103.30
Daily Plan 8.11.23
These are setups I see from Volume Profile perspective, any trade taken by you is accepting all risk at stake! Always know what is at risk before entering any trade. The purpose of these are to show what a Volume Profile trader is looking at.
ES Long 4504 > 4530 / Short 4492 > 4450
NQ Long 15315 > 15440 / Short 15256 > 15040
GC Long 1952.9 > 1964 / Short 1948.5 > 1936
CL Long 82.88 > 84 / Short 82.28 > 81
SPY Calls above 447.93 / Puts below 446.59
AAPL Calls above 179.76 / Puts below 179.13
TSLA Calls above 246.05 / Puts below 244.52
NVDA Calls above 433.59 / Puts below 428.12
MSFT Calls above 326.17 / Puts below 324.22
AMZN Calls above 139.51 / Puts below 138.76
AMD Calls above 112.63 / Puts below 111.45
GOOGL Calls above 130.62 / Puts below 130.21
META Calls above 309.23 / Puts below 306.91
-Flint
Disclaimer: This post is not trading or investment advice, but for general informational purposes only. This post represents my personal opinions which I am sharing publicly as my personal trading journal. Futures, stocks, bonds trading of any kind involves a lot of risk. No guarantee of any profit whatsoever is made. In fact, you may lose everything you have. So be very careful. I guarantee no profit whatsoever, You assume the entire cost and risk of any trading or investing activities you choose to undertake. You are solely responsible for making your own investment decisions. Owners/authors of this newsletter, its representatives, its principals, its moderators and its members, are NOT registered as securities broker-dealers or investment advisors either with the U.S. Securities and Exchange Commission, CFTC or with any other securities/regulatory authority. Consult with a registered investment advisor, broker-dealer, and/or financial advisor. Reading and using this newsletter or any of my publications, you are agreeing to these terms. Any screenshots used here are the courtesy of Ninja Trader, Think or Swim and/or TradingView. I am just an end user with no affiliations with them.


Thanks for the updates. I sit possible to send important updates during the day in the Telegram channel besides X? X is so much harder to follow...
Hi Flint, what indicator do you use on TV for Net New Highs you show in this post on X? -> https://twitter.com/tomthetrader1/status/1690125342617513984?s=20
Thank you!