Good morning, readers!
In yesterdays trading session, Emini and Nasdaq exhibited significant volatility, once again demonstrating a round trip from highs to lows. Emini encountered a sharp decline of 39 handles, setting the day's low (LOD), but later retraced back to the 4517 level. However, this retracement was short-lived as it collapsed back to lows, presenting another potential short setup for traders.
Meanwhile, the Nasdaq exceeded expectations yet again, showcasing remarkable resilience. Surprisingly, the Nasdaq sold off by an impressive 280 handles below the short level. This decline was further accentuated by an additional 140 handles of selling as Emini reached the 4517 level.
In the realm of trading, even a single session on a volatile day can significantly impact the entire week. The recent market movements provide traders with a favorable position leading into tomorrow's Consumer Price Index (CPI) report. A successful session can serve as a cushion, potentially mitigating risks associated with upcoming economic data.
Amidst this market turbulence, oil continued to exhibit strength, registering another robust session with momentum persisting to the upside. Notably, oil gained over +200 pips above a key level, which had been the low point of the night.
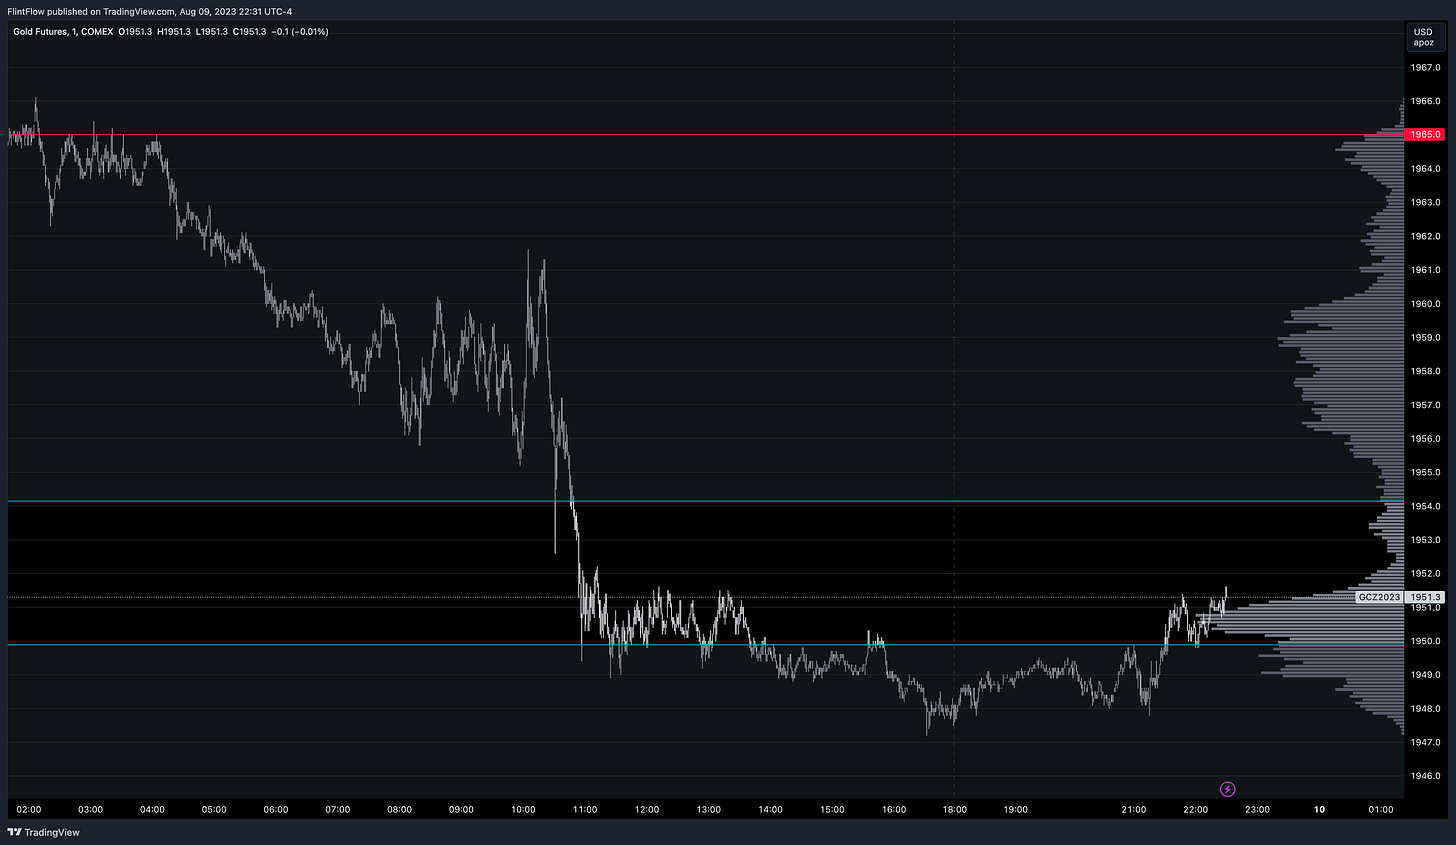
In contrast, gold experienced a stark collapse, breaching the short level and resulting in a notable 16 handle sell-off. This sharp move caught the market's attention as it rapidly surpassed established targets.
The broader stock market displayed a persistent pattern of selling, indicating a robust continuation of the downward trend. This decline is approaching key trend pivots that will likely hold significance for future market movements.
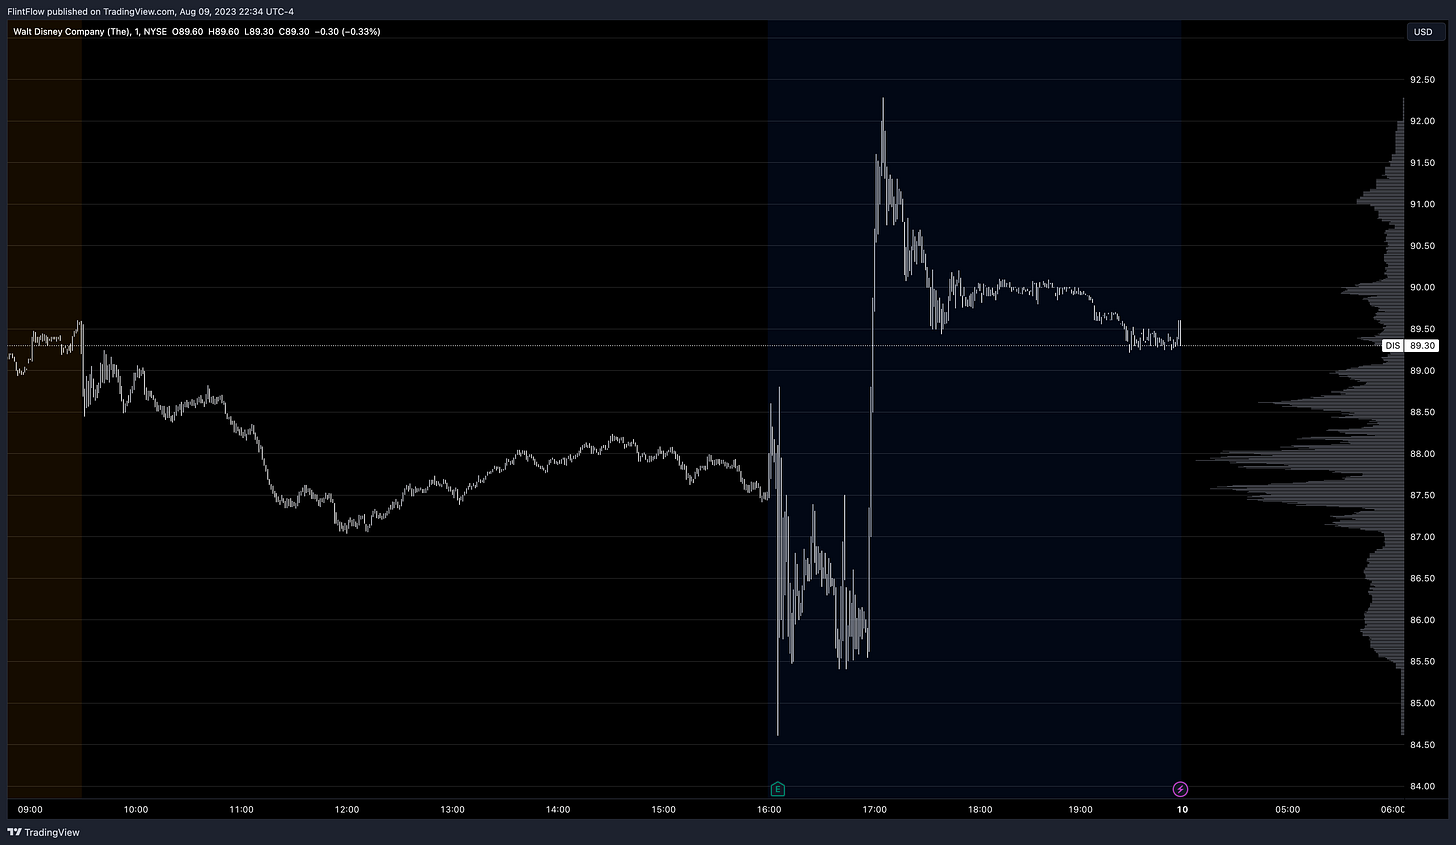
Shifting focus to earnings, Disney's Earnings call materialized as anticipated. Following the report, there was a strong spike in the stock price after the market close, reminiscent of a gathering at the iconic Mickey Mouse clubhouse. These events underscore the intricate dynamics and opportunities that unfold within the ever-evolving landscape of financial markets.
Just a little more recap, and then we will delve into my thoughts on the CPI report for tomorrow.
Sector Performance (Previous Session)
The recent market performances of various sectors have been marked by a mix of gains and losses, reflecting a dynamic landscape. Technology and Communications sectors both experienced declines of around 1.3%, possibly due to profit-taking and concerns about regulatory changes. These sectors play critical roles in our digital world, and while short-term setbacks occurred, their long-term potential remains intact.
The Consumer Discretionary sector saw a decline of 1.15%, which may be attributed to consumer spending concerns or shifts in behavior. This sector encompasses a wide range of industries, including retail and entertainment, which are closely tied to consumer sentiment and economic conditions.
The Industrial and Health Care sectors both showed minor declines, around -0.04%. These sectors are influenced by various factors, such as manufacturing trends, supply chain dynamics, and regulatory changes. The marginal drops might indicate relatively stable underlying fundamentals.
Materials and Financials sectors experienced moderate declines of around -0.5%, reflecting potential supply chain disruptions, commodity price fluctuations, and regulatory challenges. These sectors play crucial roles in the economy, and their performance might signal broader economic challenges.
On the positive side, Real Estate, Consumer Staples, Utilities, and Energy sectors all posted gains ranging from 0.21% to 0.67%. The upticks in these sectors might indicate investor preferences for stability, income generation, and evolving energy market conditions.
Indices Resting on Support - What does this mean for CPI?
First let’s cover what this report is and why the FED uses this for interest rates.
The Consumer Price Index (CPI) is a widely used economic indicator that measures the average change over time in the prices paid by urban consumers for a market basket of consumer goods and services. It is designed to reflect the general inflation experienced by the average consumer and serves as a key tool for monitoring and analyzing price trends in an economy. The CPI is used by various stakeholders, including policymakers, economists, businesses, and investors, to assess inflation rates, adjust income and expenditure streams, and make informed decisions.
The CPI is calculated and published regularly by government statistical agencies, such as the U.S. Bureau of Labor Statistics (BLS) in the United States. The process involves several steps:
Market Basket Selection: The BLS chooses a representative "market basket" of goods and services that are commonly purchased by urban consumers. This basket includes a variety of items, such as food, housing, clothing, transportation, medical care, and entertainment.
Price Collection: Prices for the items in the market basket are collected from thousands of retail outlets, service establishments, and other sources across different regions of the country. Trained data collectors visit stores, websites, and other venues to record the prices of specific items.
Weighting: Each item in the market basket is assigned a weight based on its relative importance in the average consumer's spending. For example, housing and food costs generally have higher weights than entertainment expenses.
Calculation of Price Index: The CPI is calculated using a weighted average formula. It compares the cost of the market basket in the current period to its cost in a base period (usually a specific year set as the reference point), and then it expresses this ratio as an index number.
CPI = (Cost of Market Basket in Current Period / Cost of Market Basket in Base Period) x 100
Inflation Calculation: The percentage change in the CPI over time indicates the rate of inflation. A positive change indicates inflation, while a negative change indicates deflation.
The key factors that make up the Consumer Price Index include various categories of goods and services:
Food and Beverages: Tracks changes in food prices, including groceries, drinks, and eating out.
Housing: Covers rent, homeownership costs, utilities, and related expenses.
Apparel: Monitors clothing and footwear prices for all ages.
Transportation: Includes gasoline, public transport, vehicle costs, and insurance.
Medical Care: Tracks medical services, drugs, insurance, and supplies.
Recreation: Covers entertainment and leisure expenses.
Education and Communication: Encompasses education and communication costs, like tuition and phone services.
Other Goods and Services: Includes personal care, tobacco, and miscellaneous items.
Additionally, here are shortened descriptions of different CPI measures:
All Items CPI: Measures overall average price change for the entire market basket.
Core CPI: Excludes volatile food and energy prices to show underlying inflation.
Chained CPI: Adjusts for changing consumer choices as prices shift.
Regional and City CPI: Offers insights into price changes in specific areas.
The Federal Reserve (often referred to as the Fed) uses the Consumer Price Index as a crucial tool for its monetary policy decisions, particularly in determining interest rates. Here's why:
The Fed monitors inflation through the CPI to maintain stable prices. It guides monetary policy by adjusting interest rates based on CPI trends. If CPI rises, rates might increase to control inflation; if it's low, rates could be lowered to boost the economy. CPI is a vital indicator among GDP, employment, and spending for the Fed's decisions.
What are my expectations?


