Good morning traders!
Yesterdays session was one of the strongest reclaims of a value area we have seen in a while. On Wednesday emini took out the 4095 VAL setting the stage for a potential sell down to 4068 which was given in the Weekly Outlook, see below:
Note there was a typo which I never came across until later in the week so it will say 40468 rathe than 4068. Besides that, emini sold down to exact low of 4068 before reversing back up into the close up to 4070s. Shortly after the close earnings were posted sparking move higher all the way until the next day session (yesterday). While recording the video I marked 4091 as a level to long on emini. This price was only hit while recording unfortunately taking the opportunity out of the cash session unless joining in on the move later. To also add to this gap up we had GDP data come out showing a weakening economy which while was taken bearish at first, this is exactly what to expect with a contracting economy. Consumers have yet to let off the throttle on spending which only makes the GDP report have less progress than the data release alone. Keeping spending high only makes it harder for prices to come down stretching out the period to tame inflation.
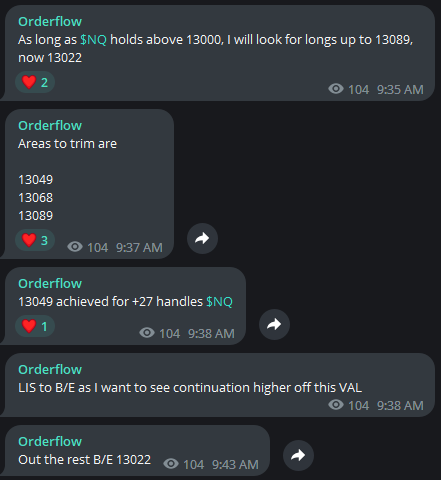
Adding in the recent data I was actually caught on wrong side of the move yesterday yet had arguably the best fill on $NQ long at market open. Let’s jump into how the session started while knowing I went into the session with a data bias which was wrong.
After tech posting earnings (still more ahead), my focus shifted to NASDAQ especially with the very slow price action emini started the day with. 1st trade to start the day if not taken out at B/E would of offered potentially the highest MFE of any intraday NQ trade.
$NQ did rally up to T1 which locked in +27 handles to start the session, but shortly after with the attempt to break lows the long was cut. From that exact point the market rallied 310 handles straight up.
This is when so much time and energy was wasted as I started to short a trend. 3 trades went short and all of them were stopped out B/E other than the last one which was a -14 handle hit. This was starting to annoy me and I decided I was going to walk away and recollect. These trades while causing little to no damage, they were taking a toll on my mental capital on the session. Here is some thoughts given after recollecting:
On the flip side there was one more indication of this trend day not fizzling out which was met with a massive ripper to session highs on $ES. As many know after reading “Introduction to Volume Profile” trend days create pockets of value and will hold each pocket before moving up to the next one. For explaining a robust example of trend day we will use $NQ.
Notice how on the intraday profile we held lows of each pocket of value before taking out the highs and creating another pocket only to keep repeating this all the way into the close. How I trade trend days after not calling direction out right away is looking for longs at the low of a pocket. Once a low is taken out then the trend is invalidated.
Right?
Now we will take a look at emini:
At 1055 EDT emini broke below its pocket of value before rallying 10 handle in 3 minutes spiking prices to a new pocket of value. From that point on emini respected the trend and saw little to no dip the remainder of the session.
While it was a very tough session after getting out of $NQ long, there was so much opportunity on the long side!
Before jumping into the data / levels I want to show some love to the SNAP 0.00%↑ FRC 0.00%↑ TOP 0.00%↑ calls that were made. Note TOP 0.00%↑ was a extremely common pump and dump chart that I have studied plenty of in the past. No interest in taking a piece in longs but every time these stocks crater off highs then just grind down into the abyss.
As I type this we have continued to grind down and stock has been crushed.
170 level sold instantly down to 100, bounced to new high and now at lows in the 70s. Over 100 handles lost on this stock OVN and I expect this to be a dud from here on out as long as below 135.
Shared by me at 11 and now trading at 8.
FRC 0.00%↑ was a name given inside the telegram which has collapsed from 11.5 to 4.7!
For todays session I want to see 4140 defended for attempts higher at 4170s. 4153 POC was hit with sellers yesterday so today we will give another go and see if we can rinse out shorts. I think this move still has shorts and has ability to squeeze higher.
Events
PCE
The Personal Consumption Expenditures (PCE) is an index used to measure the changes in the price level of goods and services consumed by households. It is released by the US Bureau of Economic Analysis on a monthly basis. The PCE is an important economic indicator as it reflects changes in overall spending patterns in the economy.Earnings
Value Areas
4095 - 4192 / POC 4153
3880 - 4048 / POC 3951
3823 - 3878 / POC 3862


