


Welcome back, everyone. I hope you had a great session yesterday.
Looking around, you can clearly tell that many are in a state of panic. Crypto and the AI trade are to blame for this, as both are taking a massive hit. To be quite honest, all of it really sucks, but there are lessons to be learned for many. The most relevant one is not so much about position size, but rather having a method to spot downturns in the market.
It often seems like drops just fall out of the sky, but there are always indications that one is coming. Rarely do we get a full-on collapse of markets without warning. The main indicator I recommend everyone put on their chart is the 10-week EMA. Every session, go to the weekly chart on the S&P and Nasdaq and check if we are currently above or below this moving average. All uptrends start with a weekly close above this, and all downtrends start by a weekly close below it. This isn’t to say this is the only moving average that works, but it will without a doubt save your butt. Recently, this would have signaled you to pull risk from the market or at least have a hedge.
The only tricky part with all of this is that if you were buying software companies in the last six months, the moving average on the Nasdaq would not have saved you. However, using it the same way on individual stocks is a great method to see the current trend. Over the last year, I became very vocal about the collapse of the software space. Nobody was going to be able to time it perfectly, as these moves are being driven by increasing competition causing a lack of returns.
No matter what industry, you want to focus on the top three stocks as they hold most of the market share. You may pick an up-and-coming company that has the potential to take over, but that doesn’t happen often. With software, we saw a large rise of many companies all competing with each other. AI made it so easy to offer services that a company could suddenly do what it couldn’t before. It became a trend where one company makes a service, and then another comes in and does the exact same thing. Eventually, all these companies offer the same product and fight each other on price. Stagnant demand with increasing supply will ultimately bring prices down. You either slash the price to get new customers or you keep prices high and lose customers. There is no winning scenario in that case.
Knowing this was a possibility last year, we got confirmation through Oracle earnings. This was the start of the large downfall of the software sector. We called for this earnings season to reveal just how bad the revenues were going to be. The spending on AI was clearly not justified. Even a slight miss on earnings can bring much higher uncertainty. Remember, these stocks saw massive moves to the upside on promises of how great their investments in AI would turn out. As these numbers prove to be far off, the stocks get repriced to levels below the initial AI run.
I don’t want this to be a “told you so,” but everything we are seeing is quite obvious. Like I said, nobody knows exactly when corrections will come, but knowing the reason will have you prepared. Anytime we get a cycle, you need to pay attention to what would and wouldn’t be good. For instance, the real winner in AI is semiconductors. Software companies spent billions on AI and got nothing to show for it, while semiconductors took in this behemoth of money for chips. Look at Nvidia; the stock is still holding relatively strong after there was a large slowdown in deals being made. They are already pulling in all the money. For Nvidia to go down, we would need to see realistic numbers on AI revenue causing the flow of orders for chips to drop. These are the next steps in the overall AI cycle. Don’t predict what comes next; wait for confirmation and then allocate funds to the main beneficiaries.
Now that all of that is out of the way, we can focus on how yesterday’s levels went.
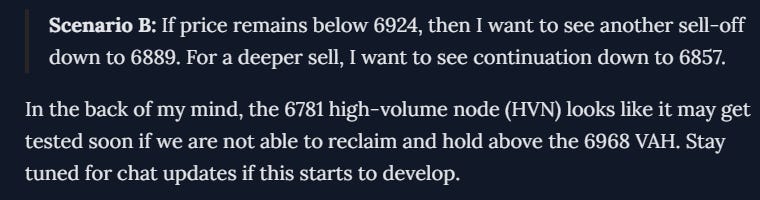
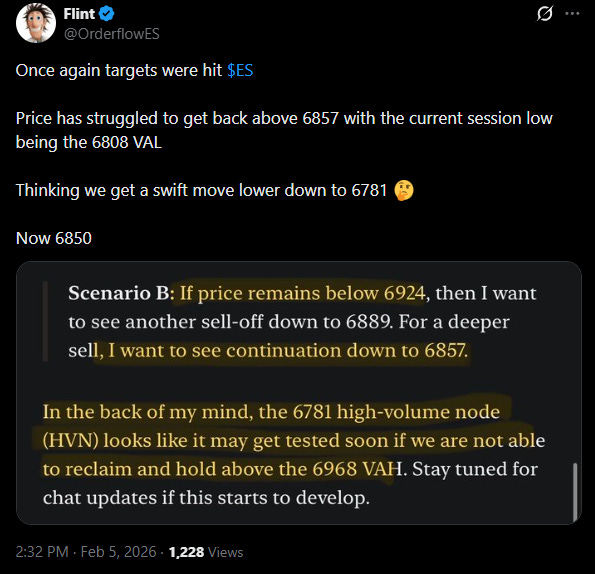
Once again, Volume Profile proves to be dominant in spotting where buyers and sellers are in control. We not only sold from our short level at 6924, but we also broke both targets and hit my weekly extreme at 6781. That is a 140-handle sell-off. Notice how not once did we mention looking for support for a potential dip buy. Selling yesterday was crystal clear just based on the structure of the overall profile. Price rallied at the open and came close to the 6889 high-volume node (HVN), which was the first target. If you had the 6830 SPX puts, you would have captured nearly 200%.
Then again, later in the session, I warned of price rolling over down to 6781. This was sent near a recent bounce high up to 6857, which was a level also used for a second short target. From there, if you had the SPX 6810 puts, you would have netted 530% if held to the session low.
This has been a tremendous week if following the levels, and it will only get better as volatility increases.
We will now shift our focus to the S&P levels for today.
