


Welcome back, everyone.
Yesterday was a decent session with both the short and long levels coming into play. Initially, price spiked up to the 6889 short level, which broke shortly after. The rally continued, breaking above the 6898 long level, and spiked 27 handles to set the high of the day (HOD). This fell just short of the 6932 point of control (POC) target. If you were looking strictly for the target to hit, then you would have ended with nothing on the day. If you took profit on the way up, then you would have finished the session covering the short and more.
Here’s the levels posted in yesterdays letter:
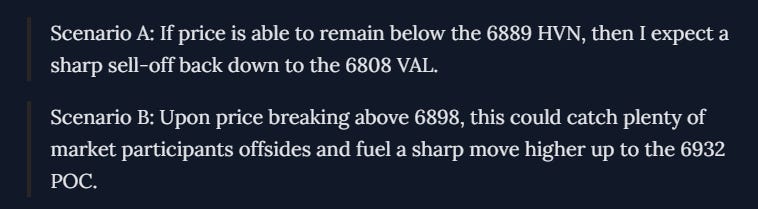
Overall, it was a much slower session after the sharp rally at the open. An interesting point to make is the fact that sellers are stepping in at 6932 (or just below), which is where most of the volume has traded for the last three months. As I previously spoke about, the POC tells you where the majority of positioning is. Below the POC, sellers are in control; above it, buyers are in control. Not only can you lean on the value area high (VAH) and value area low (VAL) for trades, but you can also use the POC. An example of this will be the levels for today’s session that will be posted below.
Other than the S&P levels, our stocks posted in this letter are performing quite well, with the overall return being up 22.09%. This overall figure is the total percent change the stocks have moved since entry. If you allocated 5% of your funds into each, you would net a total of +22%. Relative to the SPY, which is up 0.46%, and the QQQ, which is down 1.20%, our stocks are outperforming by a large margin. The majority of these stocks are not in tech, which has been hit the hardest lately. All of the stocks posted showed very simple setups, featuring increased buying relative to the last 52 weeks and breaking above moving averages.
I know I sound like a broken record mentioning all these stocks already posted, but there really isn’t much to cover outside of the S&P levels right now. One stock to mention is LBRT, which was given at 12; the stock has crossed 27 and continues to break to new highs. SHEL, another energy stock, is also making a push to new highs, which feels like ages since we posted it. Time and time again, these oil stocks start to rally and then fizzle out. As of right now, it looks like we have actually caught a real rally. Both of these stocks look primed for multi-week trends to the upside. To be clear, we gave these stocks at much cheaper prices, so I would have no interest in chasing them here unless using a wide stop.
What we can update is where the QQQ sits on the weekly chart. Price climbed back up toward the 10-week EMA before selling right back down to the 21-week EMA in today’s session. I sent out a warning on X about this exact development. From there, the market put in an intraday high. As a reminder, I will become bullish on tech on a weekly close above the 10-week EMA. With the trend for the last two weeks being to sell from the 10-week, I think we will continue to push to fresh lows into next week. All of this can change based on the weekly close this Friday. Above the 10-week EMA is bullish, and below the 10-week EMA is bearish. Keep it simple.
We will now move on to the S&P levels for today’s session.
